
This test case aims at providing a challenging task for ontology matching systems in the domain of large directories. The test case set up is provided here.
In OAEI-2009, 7 out of 15 matching systems participated on the web directories test case, while in OAEI-2008, 7 out of 13, in OAEI-2007, 9 out of 18, in OAEI-2006, 7 out of 10, and in OAEI-2005, 7 out of 7 did it.
Precision, Recall and F-measure results of the systems on the web directories test case are shown in Figure 1. These indicators have been computed following the TaxMe2 methodology, with the help of Alignment API, version 3.4.
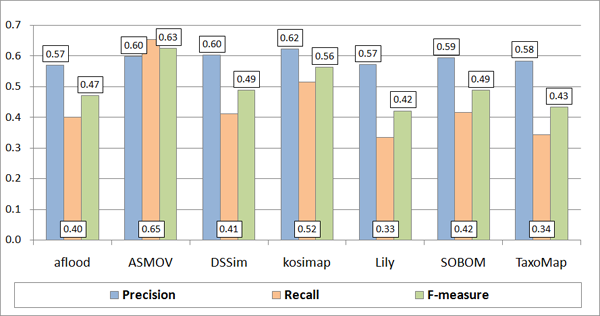
Figure 1. Matching quality results.
We can observe from Table 1, that in general the systems that participated in the directory track in 2008 (DSSim, Lily and TaxoMap), have either maintained or decreased their precision and recall values. The only system that increased its recall values is ASMOV. In fact, ASMOV is the system with the highest F-measure value in 2009.
Table 1 shows that in total 24 matching systems have participated during the 5 years (2005 - 2009) of the OAEI campaign in the directory track. No single system has participated in all campaigns involving the web directory dataset (2005 - 2009). A total of 16 systems have participated only one time in the evaluation, only 3 systems have participated 2 times, and 5 systems have participated 3 times.
Table 1. Summary of submissions by year.
| # | Matching System | Recall | Precision | F-measure | ||||||||||||
| 2005 | 2006 | 2007 | 2008 | 2009 | 2005 | 2006 | 2007 | 2008 | 2009 | 2005 | 2006 | 2007 | 2008 | 2009 | ||
| 1 | aflood | 0.40 | 0.57 | 0.47 | ||||||||||||
| 2 | ASMOV | 0.44 | 0.12 | 0.65 | 0.59 | 0.64 | 0.60 | 0.50 | 0.20 | 0.63 | ||||||
| 3 | automs | 0.15 | 0.31 | 0.20 | ||||||||||||
| 4 | CIDER | 0.38 |
0.60 |
0.47 | ||||||||||||
| 5 | CMS | 0.14 | ||||||||||||||
| 6 | COMA | 0.27 | 0.31 | 0.29 | ||||||||||||
| 7 | ctxMatch2 | 0.09 | ||||||||||||||
| 8 | DSSim | 0.31 | 0.41 | 0.41 | 0.60 | 0.60 | 0.60 | 0.41 | 0.49 | 0.49 | ||||||
| 9 | Dublin20 | 0.27 | ||||||||||||||
| 10 | Falcon | 0.31 | 0.45 | 0.61 | 0.41 | 0.55 | 0.43 | 0.58 | ||||||||
| 11 | FOAM | 0.12 | ||||||||||||||
| 12 | hmatch | 0.13 | 0.32 | 0.19 | ||||||||||||
| 13 | kosimap | 0.52 | 0.62 | |||||||||||||
| 14 | Lily | 0.54 | 0.37 | 0.33 | 0.57 | 0.59 | 0.57 | 0.55 | 0.46 | 0.42 | ||||||
| 15 | MapPSO | 0.31 |
||||||||||||||
| 16 | OCM | 0.16 | 0.33 | 0.21 | ||||||||||||
| 17 | OLA/OLA2 | 0.32 | 0.84 | 0.62 | 0.71 | |||||||||||
| 18 | OMAP | 0.31 | ||||||||||||||
| 19 | OntoDNA | 0.03 | 0.55 | 0.05 | ||||||||||||
| 20 | Prior/Prior+ | 0.24 | 0.71 | 0.34 | 0.56 | 0.28 | 0.63 | |||||||||
| 21 | RiMOM | 0.40 | 0.71 | 0.17 | 0.39 | 0.44 | 0.55 | 0.40 | 0.55 | 0.26 | ||||||
| 22 | SOBOM | 0.42 | 0.59 | 0.49 | ||||||||||||
| 23 | TaxoMap | 0.34 |
0.34 | 0.59 |
0.58 | 0.43 | 0.43 | |||||||||
| 24 | X-SOM | 0.29 | 0.62 | 0.39 | ||||||||||||
| Average | 0.22 | 0.26 | 0.50 | 0.30 | 0.44 | 0.35 | 0.57 | 0.59 | 0.59 | 0.29 | 0.49 | 0.39 | 0.50 | |||
| Number of participants | 7 | 7 | 9 | 7 | 7 | 0 | 7 | 9 | 7 | 7 | 0 | 7 | 9 | 7 | 7 | |
As can be seen in Figure 2 and Table 1, there is an increase in the average precision for the directory track up to 2008, remaining constant in 2009. The average recall in 2009 increased in comparison to 2008, but the highest average recall remains that of 2007. Considering F-measure, results for 2009 show the highest average in the 4 years (2006 to 2009). Notice that in 2005 the data set allowed only the estimation of recall, therefore Figure 2 and Table 1 do not contain values of precision and F-measure for 2005.
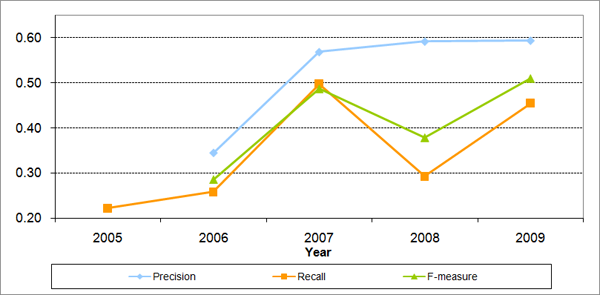
Figure 2. Average results by year.
A comparison of the results in 2006, 2007, 2008 and 2009 for the top-3 systems of each year based on the highest values of the F-measure indicator is shown in Figure 3. The key observation here is that even though two of the top-3 systems of 2008 (Lily and DSSim) participated in the directory task this year, they did not manage to get into the top-3, indicating an overall increase of performance by the total set of participating systems this year. As can be seen in Table 1, DSSim maintained its performance of 2008, having the same F-measure as SOBOM (a newcomer and 3rd place of 2009), only 1% less of recall than SOBOM, but 1% more of precision. ASMOV increased its F-measure, presenting the highest value for this year directory track, and in overall in its 3 years of participation. The second place corresponds to kosimap, also a newcomer.
The quality of the best F-measure result of 2009 (0.63) achieved by ASMOV is higher that the best F-measure of 2008 (0.49) demonstrated by DSSim and higher than that of 2006 by Falcon (0.43), but still lower than the best F-measure of 2007 (0.71) by OLA2. The best precision result of 2009 (0.62) achieved by kosimap is lower than the best precision value of 2008 (0.64) demonstrated by ASMOV and equal to the results obtained in 2007 by both OLA2 and X-SOM. Finally, for what concerns recall, the best result of 2009 (0.65) achieved by ASMOV is higher that the best value of 2008 (0.41) demonstrated by DSSim and the best value in 2006 (0.45) by Falcon, but still lower than the best result obtained in 2007 (0.84) obtained by OLA2.
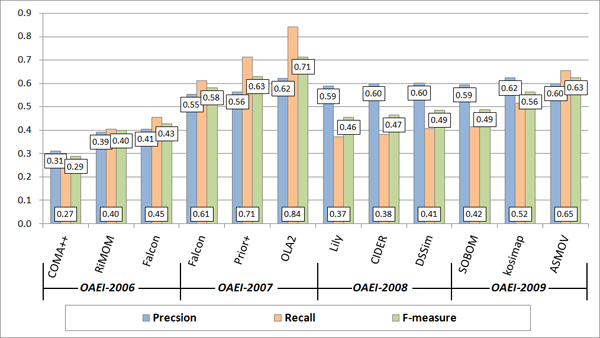
Figure 3. Comparison of matching quality results in 2006, 2007, 2008 and 2009.
Partitions of positive and negative correspondences according to the system results are presented in Figure 4 and Figure 5, respectively.
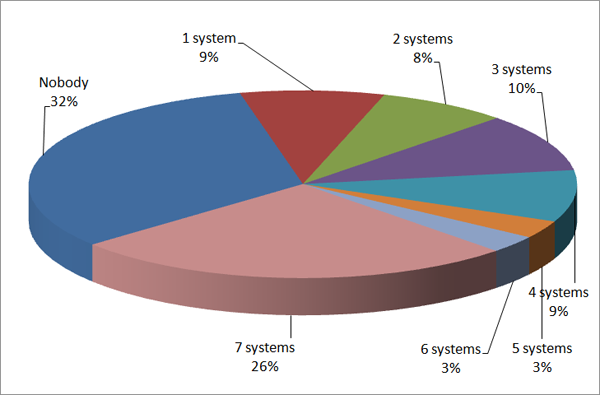
Figure 4. Partition of the system results on positive correspondences.
Figure 4 shows that the systems managed to discover only 68% of the total number of positive correspondences (Nobody = 32%). Only 26% of positive correspondences were found by all seven participating systems. The percentage of positive correspondences found by the systems this year is higher than the values of 2008, when 54% of the positive correspondences where found. Figure 5 shows that more than half (56%) of the negatives correspondences were not found by the systems (correctly) in comparison to 66% not found in 2008. Figure 5 also shows that all participating systems found 17% of the negative correspondences, i.e., mistakenly returned them as positive. The last two observations suggest that the discrimination ability of the dataset remains still high as in previous years.
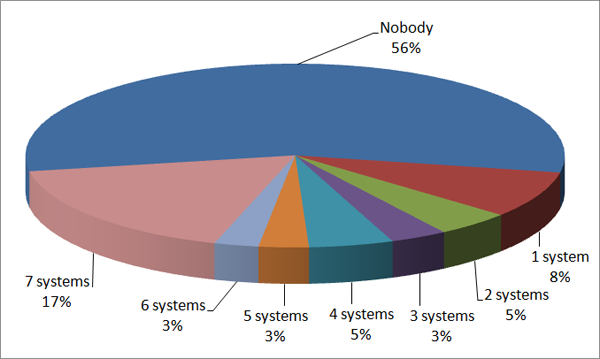
Figure 5. Partition of the system results on negative correspondences.
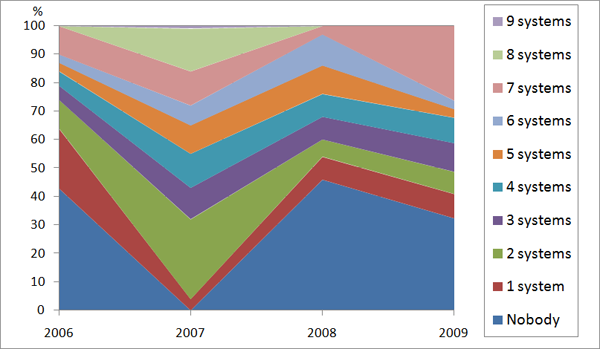
Figure 6. Comparison of partitions of the system results on positive correspondences in 2006, 2007, 2008 and 2009.
Figure 6 shows that 32% of positive correspondences have not been found by any of the matching systems this year. This value is better that the values of 2006 (43%) and 2008 (46%). In 2007 all the positive correspondences have been collectively found; these results (2007) were exceptional because the participating systems alltogether had a full coverage of the expected results and very high precision and recall. Unfortunately, the best systems of 2007 did not participate this year (nor in 2008) and the other systems do not seem to cope with the results of 2007.
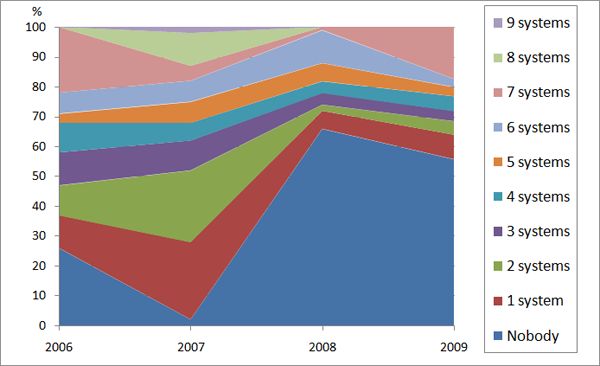
Figure 7. Comparison of partitions of the system results on negative correspondences in 2006, 2007, 2008 and 2009.
Figure 7 shows that this year 56% of the negatives correspondences were correctly not found. There is a decrease in comparison to the value of 2008, when 66% of the negatives correspondences where not found, being the best value in all years (2006 to 2009). This year 17% of the negative correspondences were mistakenly found by all the (7) participating systems, being the best value that of last year (1%). An interpretation of these observations could be that the set of participating systems in 2009 have a more "cautious" strategy than in 2007 and 2006, but still a little bit more "brave" than 2008. In 2007 we can observe that the set systems showed the most "brave" strategy in discovering correspondences of all the yearly evaluation initiatives, when the set of positive correspondences was fully covered, but covering mistakenly also 98% of the negative correspondences. This year the behavior of the overall systems is more similar (but better) to the behavior of the overall set of participating systems in 2008.
This year the average performance of the systems (given by F-Measure in Figure 2) is the best of all 4 years (2006 to 2009). This suggests that the set of participating systems have seem to encounter a balance between a "brave and cautious" behavior for discovering correspondences. However, the value for the F-measure (0.51) indicates that there is still room for further improvements. Finally, as partitions of positive and negative correspondences indicate (see Figure 4 and Figure 5), the dataset still retains a good discrimination ability as in 2007, i.e., different sets of correspondences are still hard for the different systems.
Initial location of this page: http://disi.unitn.it/~pane/OAEI/2009/directory/result/