
In the following we present the results of the OAEI 2011.5 evaluation of the benchmarks track. If you notice any kind of error (wrong numbers, incorrect information on a matching system) do not hesitate to contact José Luis Aguirre (see mail below).
The focus of this campaign was on scalability, i.e. the ability of matchers to deal with data sets of increasing number of elements. To that extent, we have generated four different benchmarks against which matchers have been evaluated: benchmark1 (biblio), benchmark2 (jerm), benchmark3 (provenance) and benchmark4 (finance). New benchmarks were generated following the same model as for previous benchmarks, from seed ontologies from different domains and with different sizes.
The following table summarizes the information about ontologies' sizes.
| Test set | biblio | jerm | provenance | finance |
| ontology size | ||||
| classes+prop | 97 | 250 | 431 | 633 |
| instances | 112 | 26 | 46 | 1113 |
| entities | 299 | 276 | 477 | 1746 |
| triples | 1332 | 1311 | 2366 | 21979 |
From the 19 systems listed in the 2011.5 final results page, 14 systems participated in this track. The reason is that several systems participating for the first time required Jdk 1.7 to be run. The systems that were left could not be ran in these conditions and they were all systems that did not present a new version for this campaign.
As new ontologies were used, some tools presented problems to pass the first test for benchmarks generated from these ontologies. We decided to give an opportunity to developers of those tools to fix the problems sending them the logs with the exceptions thrown.
The following table summarizes the list of participants. The second column indicates whether the system submitted was new for OAEI, or if it is a version or a modified version of a system that participated in OAEI 2011. The third column signals comments about special conditions to run the tools for all or part of the campaign and about the general behavior of the tools.
| Matching system | Status/Version | Comments |
| Aroma | 2011 version | --- |
| AUTOMSv2 | New | Have to fix bug. Run only for biblio benchmark |
| CODI | Modified | Needed to adjust configuration for jerm benchmark. Not able to run provenance and finance benchmarks |
| GOMMA | New | Have to fix bug for benchmarks other than biblio |
| Hertuda | New | --- |
| Lily | 2011 version | Not able to run finance benchmark |
| LogMap | Modified | --- |
| LogMapLt | New | --- |
| MaasMtch | Modified | Have to fix bug for all benchmarks |
| MapEVO | Modified | --- |
| MapPSO | Modified | Not able to finish some tests for provenance and finance benchmarks |
| MapSSS | Modified | --- |
| WeSeE | New | --- |
| YAM++ | Modified | Have to fix bug for benchmarks other than biblio. Not able to run finace benchmark |
As we stated before, the focus of this campaign was on scalability. We have addressed this from two aspects:
For each aspect all systems have been executed in the same conditions whose specifications are given below.
We have executed all systems on two cores and 8GB RAM Debian virtual machines (VM) running continuously in parallel, except for finance benchmark which required 10GB RAM for some systems. We follow the general recommendations for Linux operating systems allocating no more than 80% of available memory for running Java processes. 6GB RAM were allocated to Java processes running in 8GB RAM VMs; 8GB RAM were allocated to Java processes running in 10GB RAM Vms. An exception is CODI which needs specific requirements/tools that we can not install in our machines due to academic license problems. CODI was executed on a two cores and 8GB RAM Ubuntu VM in the SEALS infrastructure.
Three test suites (data sets) of 94 tests for each benchmark were used for measuring compliance. Small test suites containing samples of the benchmarks are available here.
The following table presents the average precision, F-measure and recall for the 3 runs and for each benchmark. We confirmed, as it was already done in the previous 2011 campaign, that these three runs are not really necessary, as even if some matchers exhibit non deterministic behavior on a test case basis, their average measures on the whole data set remains almost the same. It can be seen from the table that some matchers exhibit similar behavior between different benchmarks, but other ones show great variations rendering non significant alignments in some cases.
| Matching system | biblio | jerm | provenance | finance | ||||||||
| Precision | F-measure | Recall | Precision | F-measure | Recall | Precision | F-measure | Recall | Precision | F-measure | Recall | |
| Aroma | 0.97 | 0.76 | 0.63 | 0.99 | 0.96 | 0.93 | 0.78 | 0.60 | 0.49 | 0.90 | 0.70 | 0.57 |
| AUTOMSv2 | 0.97 | 0.69 | 0.54 | n/a | n/a | n/a | n/a | n/a | n/a | n/a | n/a | n/a |
| CODI | 0.93 | 0.75 | 0.63 | 1.00 | 0.96 | 0.93 | n/a | n/a | n/a | n/a | n/a | n/a |
| GOMMA | 0.79 | 0.67 | 0.58 | 0.97 | 0.67 | 0.51 | 0.14 | 0.22 | 0.55 | 0.84 | 0.66 | 0.55 |
| Hertuda | 1.00 | 0.67 | 0.50 | 0.96 | 0.66 | 0.50 | 0.59 | 0.54 | 0.50 | 0.75 | 0.60 | 0.50 |
| Lily | 0.95 | 0.75 | 0.62 | 0.93 | 0.71 | 0.58 | 0.92 | 0.68 | 0.54 | u/r | u/r | u/r |
| LogMap | 0.69 | 0.48 | 0.37 | 1.00 | 0.66 | 0.50 | 1.00 | 0.66 | 0.49 | 0.96 | 0.60 | 0.43 |
| LogMapLt | 0.7 | 0.58 | 0.50 | 0.98 | 0.67 | 0.51 | 0.99 | 0.66 | 0.50 | 0.90 | 0.66 | 0.52 |
| MaasMtch | 0.49 | 0.50 | 0.52 | 0.52 | 0.52 | 0.52 | 0.50 | 0.50 | 0.50 | 0.52 | 0.52 | 0.52 |
| MapEVO | 0.43 | 0.37 | 0.33 | 0.06 | 0.04 | 0.03 | 0.02 | 0.01 | 0.01 | 0.04 | 0.02 | 0.01 |
| MapPSO | 0.58 | 0.20 | 0.12 | 0.06 | 0.05 | 0.05 | 0.08* | 0.07* | 0.05* | 0.28** | 0.16** | 0.11** |
| MapSSS | 0.99 | 0.86 | 0.75 | 0.98 | 0.76 | 0.63 | 0.98 | 0.75 | 0.61 | 0.99 | 0.83 | 0.71 |
| WeSeE | 0.89 | 0.67 | 0.53 | 0.99 | 0.68 | 0.51 | 0.97 | 0.64 | 0.48 | 0.96 | 0.69 | 0.54 |
| YAM++ | 0.99 | 0.83 | 0.72 | 0.99 | 0.72 | 0.56 | u/r | u/r | u/r | n/a | n/a | n/a |
n/a: not able to run this benchmark
u/r: uncompleted results, crashed or got stuck with some test
*: just one of three runs was completed
**: just two of three runs were completed
All results have been stored in the SEALS Raw Result Repository (RRS) and are available through the SEALS portal with the identifiers OMT-2011.5-%BENCHMARK%-benchmarks-r%RUN%-%SYSTEM%-rr for raw results and OMT-2011.5-%BENCHMARK%-benchmarks-r%RUN%-%SYSTEM%-ir for interpretations. For example OMT-2011.5-jerm-benchmarks-r2-Hertuda-rr for the raw results of the second run of the jerm benchmark for Hertuda.
Based on the standard deviation for F-measure, which is shown in the next table, the less variable matcher is MaasMtch, followed by WeSeE. The matcher having the greatest variability was GOMMA, but this is due to the result obtained with the provenance benchmark. We exclude from this table matchers that were not able to pass at least one run for provenance and finance benchmarks.
| Matching system | biblio | jerm | provenance | finance | Standard deviation |
| MaasMtch | 0.50 | 0.52 | 0.50 | 0.52 | 0.01 |
| WeSeE | 0.67 | 0.68 | 0.64 | 0.69 | 0.02 |
| Lily | 0.75 | 0.71 | 0.68 | u/r | 0.04 |
| LogMapLt | 0.58 | 0.67 | 0.66 | 0.66 | 0.04 |
| MapSSS | 0.86 | 0.76 | 0.75 | 0.83 | 0.05 |
| Hertuda | 0.67 | 0.66 | 0.54 | 0.60 | 0.06 |
| MapPSO | 0.20 | 0.05 | 0.07* | 0.16** | 0.07 |
| LogMap | 0.48 | 0.66 | 0.66 | 0.60 | 0.08 |
| Aroma | 0.76 | 0.96 | 0.60 | 0.70 | 0.15 |
| MapEVO | 0.37 | 0.04 | 0.01 | 0.02 | 0.17 |
| GOMMA | 0.67 | 0.67 | 0.22 | 0.66 | 0.22 |
u/r: uncompleted results, crashed or got stuck with some test
*: just one of three runs was completed
**: just two of three runs were completed
From the table we also observe that almost all of the tools got better results with biblio benchmark. Finally, the group of best systems in each data set remains relatively the same across the different seed ontologies: MapSSS revealed having the best results for three of the four benchmarks, with Aroma, Lily and WeSeE as followers.
We used a 3GHz Xeon 5472 (4 cores) machine running Linux Fedora 8 with 8GB RAM. CODI was excluded form this tests as it needs specific requirements/tools that we were not able to met due to academic license problems. AUTOMSv2 was tested only with biblio benchmark as it throws an exception with other benchmarks. YAM++ and Lily were not able to finish some benchmarks as they got stuck at one test for more than 12 hours.
Just one test suite of 15 tests were used for each benchmark. The following table presents the runtime measurement (in seconds) for those test suites. At a first glance, we observe that some tools exhibit a more or less stable behavior with respect to the number of classes and properties contained in the seed ontologies; other ones exhibit a chaotic one as big differences are observed in their behavior when dealing with different benchmarks.
| Matching system | biblio | jerm | provenance | finance |
| LogMapLt | 7 | 7 | 8 | 32 |
| Hertuda | 9 | 25 | 75 | 94 |
| Aroma | 9 | 10 | 27 | 63 |
| GOMMA | 10 | 10 | 24 | 61 |
| LogMap | 16 | 16 | 20 | 53 |
| MapSSS | 26 | 52 | 98 | 66494 |
| MaasMtch | 36 | 303 | 1284 | 2341 |
| AUTOMSv2 | 63 | n/a | n/a | n/a |
| YAM++ | 76 | 3428 | u/r | n/a |
| MapPSO | 140 | 968 | u/r | u/r |
| MapEVO | 158 | 194 | 751 | 64913 |
| Lily | 433 | 2645 | 10970 | u/r |
| WeSeE | 1025 | 2087 | 5315 | 7446 |
n/a: not able to run this benchmark
u/r: uncompleted results, crashed or got stuck with some test
The following figure shows a semi-log graph for runtime measurement against benchmark size in terms of classes and properties with the y-axis representing the runtime in a logarithmic scale. Just three points were included for Lily as we were not able to run finance benchmark with it. As it could be naturally expected, all tools have associated with them increasing functions with respect to benchmark sizes.
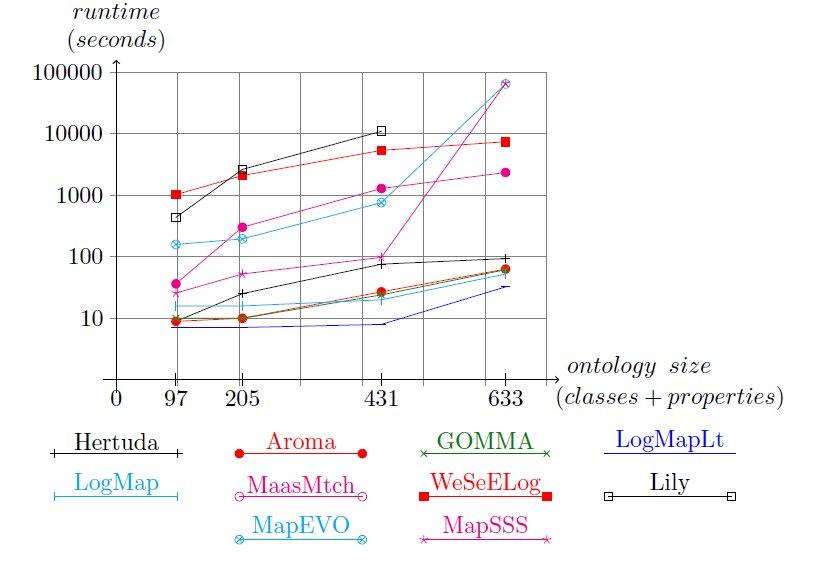
Runtime measurement VS ontology size (classes+properties)
Some observations can be done from the graph:
The experiments also show that tools are more sensitive to classes and properties contained in the ontologies than to the number of triplets. A graph relating runtime with triplets contained in the benchmarks could also be drawn to support this affirmation, but it is enough to observe the fact that biblio and jerm original ontologies have almost the same number of triplets, but results obtained for those benchmarks are very different for almost all of the tools.
More interesting analysis could be done to relate runtime response and precision and recall. Those analysis will maybe integrated in the following campaigns.
This track is organized by Jose Luis Aguirre and Jérôme Euzenat. If you have any problems working with the ontologies, any questions or suggestions, feel free to write an email to jose-luis [.] aguirre [at] inria [.] fr