
Web page content
This year we have 13 participants (DKP-AOM has also been submitted as variant DKP-AOM-Lite but it seems to be the same as DKP-AOM, therefore we only count the results of DKP-AOM). Other matchers did not generate any alignments (those matchers focusing on instance matching) or only trivial subsumption correspondences (some matchers focusing on phenotype and disease track). For overview table please see general information about results. We also provide comparison with tools that participated in previous years of OAEI in terms of highest average F1-measure.
You can download a subset of all alignments for which there is a reference alignment. In this case we provide alignments as generated by the SEALS platform (afterwards we applied some tiny modifications which we explained below). Alignments are stored as it follows: matcher-ontology1-ontology2.rdf.
Tools have been evaluated based on
We have three variants of crisp reference alignments (the confidence values for all matches are 1.0). They contain 21 alignments (test cases), which corresponds to the complete alignment space between 7 ontologies from the OntoFarm data set. This is a subset of all ontologies within this track (16) [4], see OntoFarm data set web page.
For each reference alignment we provide three evaluation modalities
| ra1 | ra2 | rar2 | |
| M1 | ra1-M1 | ra2-M1 | rar2-M1 |
| M2 | ra1-M2 | ra2-M2 | rar2-M2 |
| M3 | ra1-M3 | ra2-M3 | rar2-M3 |
Regarding evaluation based on reference alignment, we first filtered out (from alignments generated using SEALS platform) all instance-to-any_entity and owl:Thing-to-any_entity correspondences prior to computing Precision/Recall/F1-measure/F2-measure/F0.5-measure because they are not contained in the reference alignment. Next, we filter out generated alignments with "null" entities (due to the case of FCA-Map) and convert confidence values higher than 1.0 to certain confidence value (due to the case of NAISC where confidence value of 10 was used). In order to compute average Precision and Recall over all those alignments we used absolute scores (i.e. we computed precision and recall using absolute scores of TP, FP, and FN across all 21 test cases). This corresponds to micro average precision and recall. Therefore, the resulting numbers can slightly differ with those computed by the SEALS platform (macro average precision and recall). Then, we computed F1-measure in a standard way. Finally, we found the highest average F1-measure with thresholding (if possible).
In order to provide some context for understanding matchers performance we included two simple string-based matchers as baselines. StringEquiv (before it was called Baseline1) is a string matcher based on string equality applied on local names of entities which were lowercased before (this baseline was also used within anatomy track 2012) and edna (string editing distance matcher) was adopted from benchmark track (wrt. performance it is very similar to the previously used baseline2).
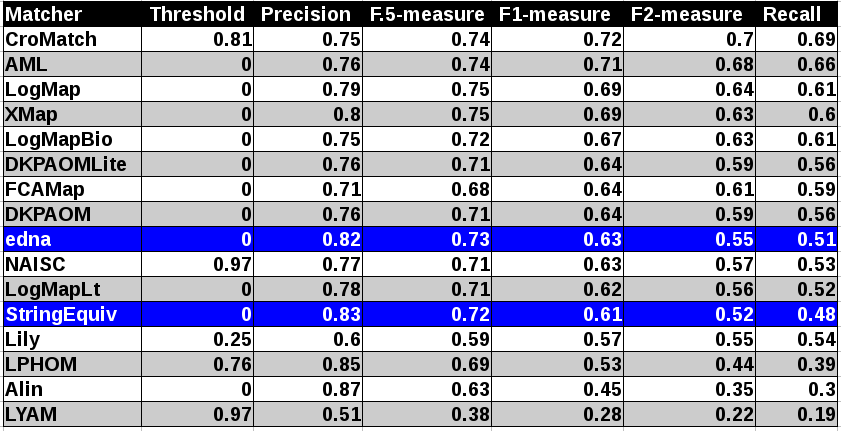
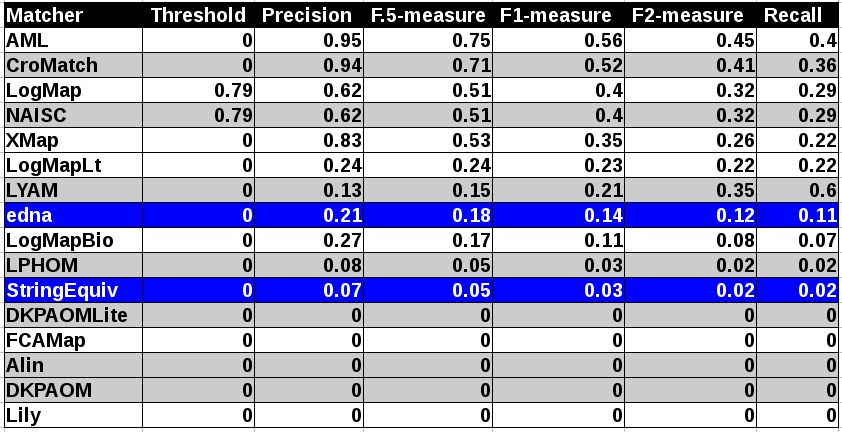
In the tables below, there are results of all 14 tools with regard to all combinations of evaluation modalities with crisp reference alignments. There are precision, recall, F1-measure, F2-measure and F0.5-measure computed for the threshold that provides the highest average F1-measure computed for each matcher. F1-measure is the harmonic mean of precision and recall. F2-measure (for beta=2) weights recall higher than precision and F0.5-measure (for beta=0.5) weights precision higher than recall.
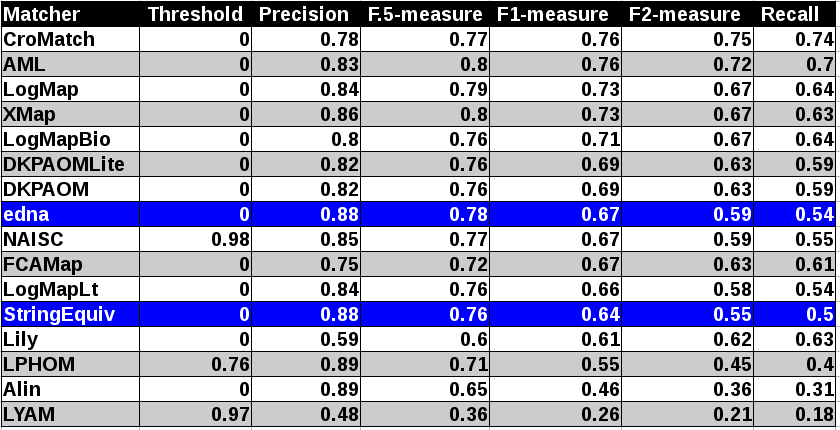
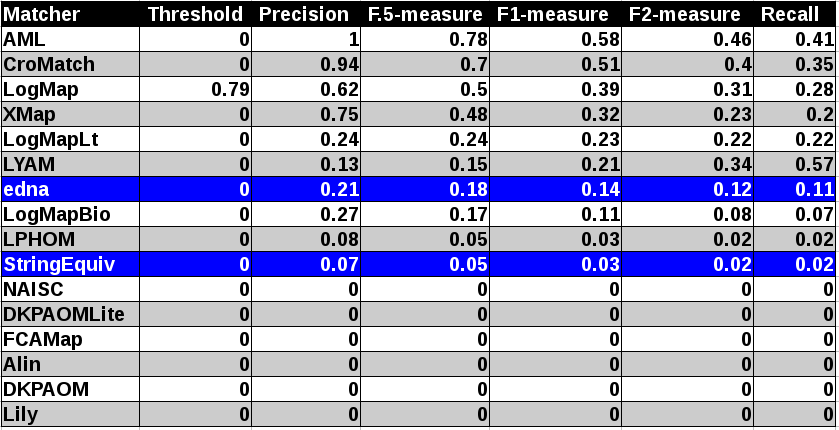
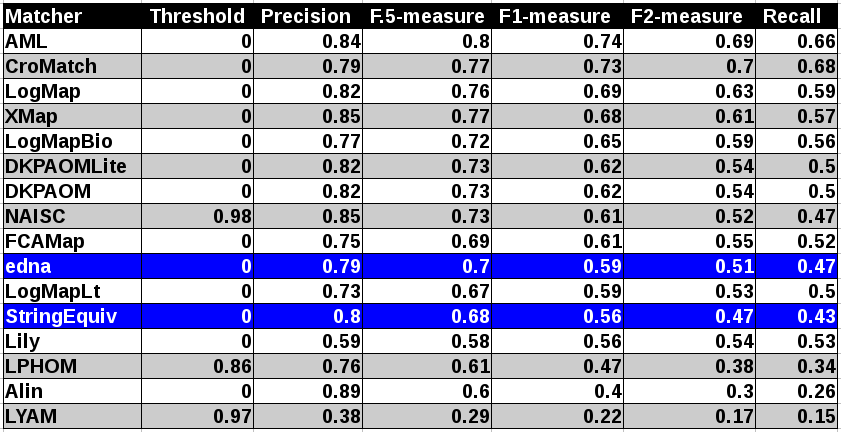
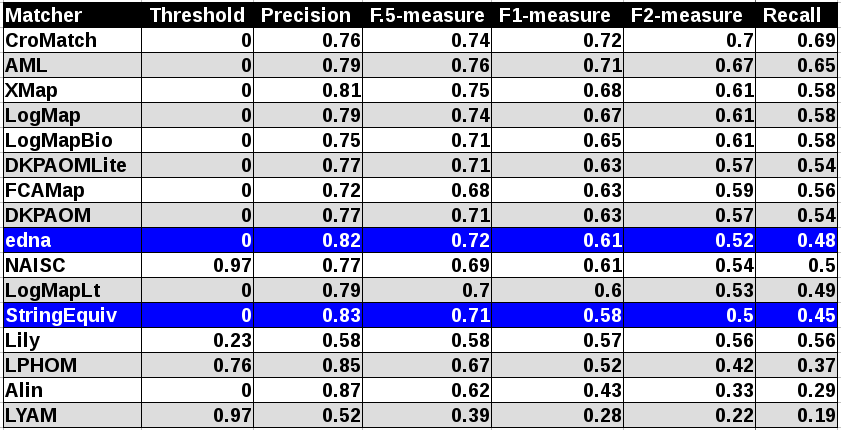
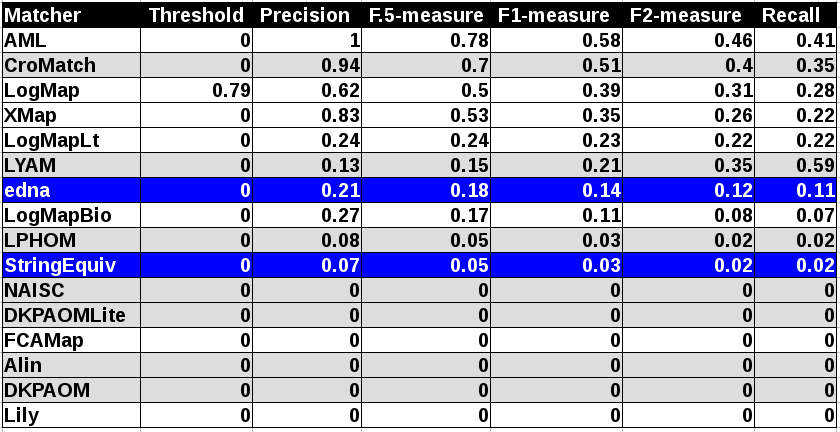

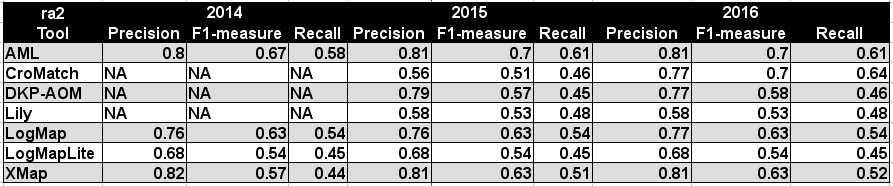
Table below summarizes performance results of tools participated last 3 years of OAEI, conference track with regard to reference alignment ra2.
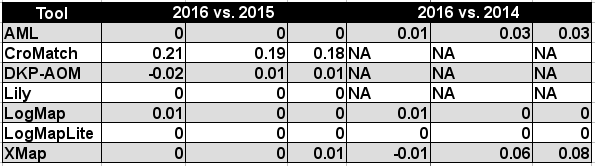
While CroMatcher achieved the highest improvement between last two years (0.19 increase wrt. F1-measure), XMap achieved the highest improvement between 2016 and 2014 (0.06 increase wrt. F1-measure), see Table below.
All tools except LYAM (precision and recall were below 0.5) are visualized in terms of their performance regarding an average F1-measure in the figure below. Tools are represented as squares or triangles. Baselines are represented as circles. Horizontal line depicts level of precision/recall while values of average F1-measure are depicted by areas bordered by corresponding lines F1-measure=0.[5|6|7].
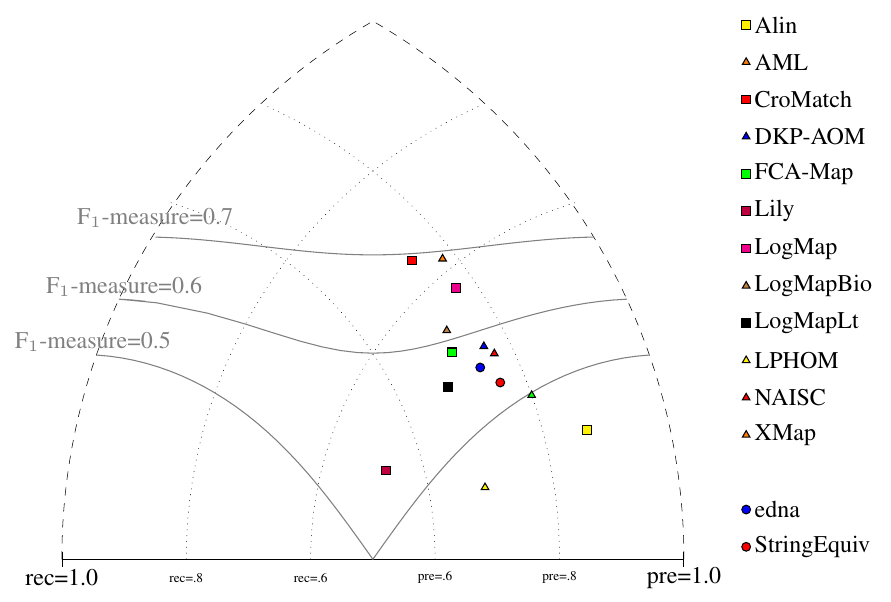
With regard to two baselines we can group tools according to matcher's position (above best edna baseline, above StringEquiv baseline, below StringEquiv baseline). There is only slight difference in first two groups between ra1-M3 and ra2-M3 regarding tools position. NAISC has the largest drop (by 0.06 of F-Measure) between ra2-M3 and ra1-M3. In all there are eight tools above edna baseline (CroMatcher, AML, LogMap, XMAP, LogMapBio, FCA-Map, DKP-AOM and NAISC) for rar2 reference alignment which is considered as most correct and most difficult reference alignment. In comparison with last year it is almost the same number of tools (in 2015 there were 8 tools). Since rar2 is not only consistency violation free (as ra2) but also conservativity violation free we consider the rar2 as main reference alignment for this year. It will also be used within the synthesis paper.
While the situation in the first group above edna baseline is almost the same considering M1 evaluation modality it is different regarding M2 evaluation modality. Two matchers moved to below edna performance and three matchers moved above edna performance. While four tools do not match properties at all (Lily, DKP-AOM, Alin and FCA-Map), NAISC also matches properties with better performance than the edna baseline. Further, interestingly, LYAM also matches properties with better performance than the edna baseline in the case of M2 but it is worse in performance than StringEquiv in the case of M1. This has an effect on overall tools performance within M3 evaluation modality.
The confidence values of all matches in the standard (sharp) reference alignments for the Conference track are all 1.0. For the uncertain version of this track, the confidence value of a match has been set equal to the percentage of a group of people who agreed with the match in question (this uncertain version is based on reference alignment labeled ra1). One key thing to note is that the group was only asked to validate matches that were already present in the existing reference alignments – so some matches had their confidence value reduced from 1.0 to a number near 0, but no new matches were added.
There are two ways that we can evaluate alignment systems according to these “uncertain” reference alignments, which we refer to as discrete and continuous. The discrete evaluation considers any match in the reference alignment with a confidence value of 0.5 or greater to be fully correct and those with a confidence less than 0.5 to be fully incorrect. Similarly, an alignment system’s match is considered a “yes” if the confidence value is greater than or equal to the system’s threshold and a “no” otherwise. In essence, this is the same as the “sharp” evaluation approach, except that some matches have been removed because less than half of the crowdsourcing group agreed with them. The continuous evaluation strategy penalizes an alignment system more if it misses a match on which most people agree than if it misses a more controversial match. For instance, if A = B with a confidence of 0.85 in the reference alignment and an alignment algorithm gives that match a confidence of 0.40, then that is counted as 0.85 * 0.40 = 0.34 of a true positive and 0.85 – 0.40 = 0.45 of a false negative.
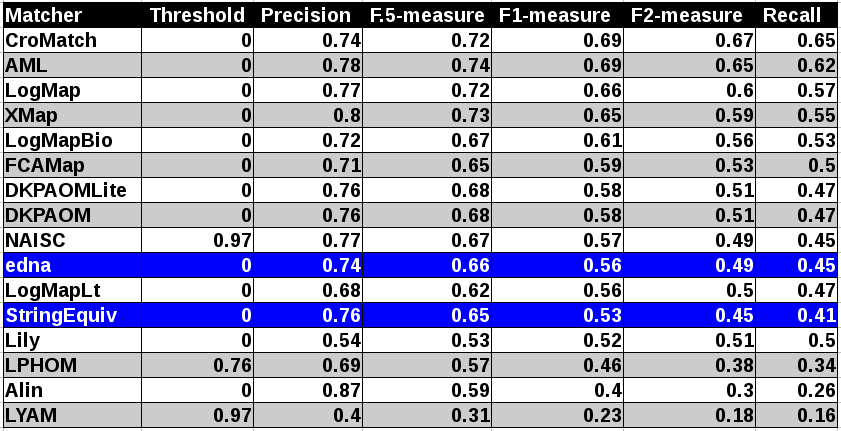
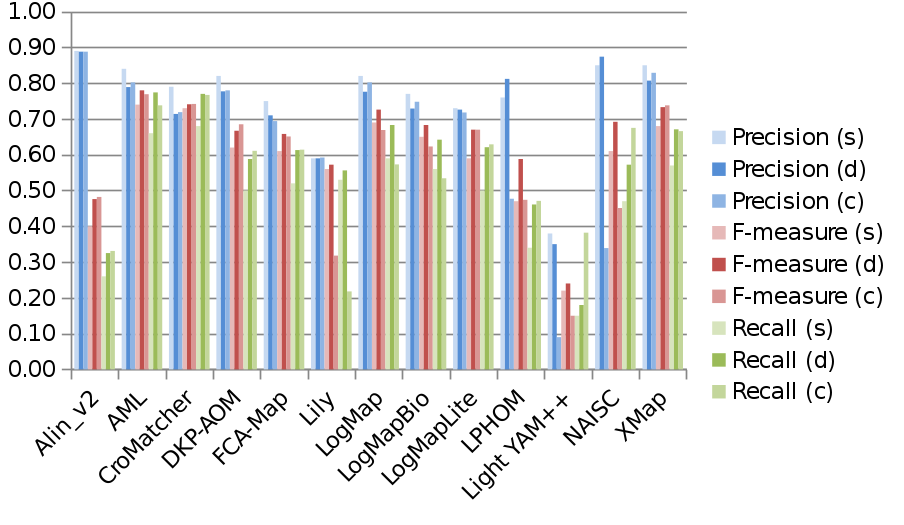
Below is a graph showing the F-measure, precision, and recall of the different alignment systems when evaluated using the sharp (s), discrete uncertain (d) and continuous uncertain (c) metrics, along with a table containing the same information. The results from this year show that more systems are assigning nuanced confidence values to the matches they produce.
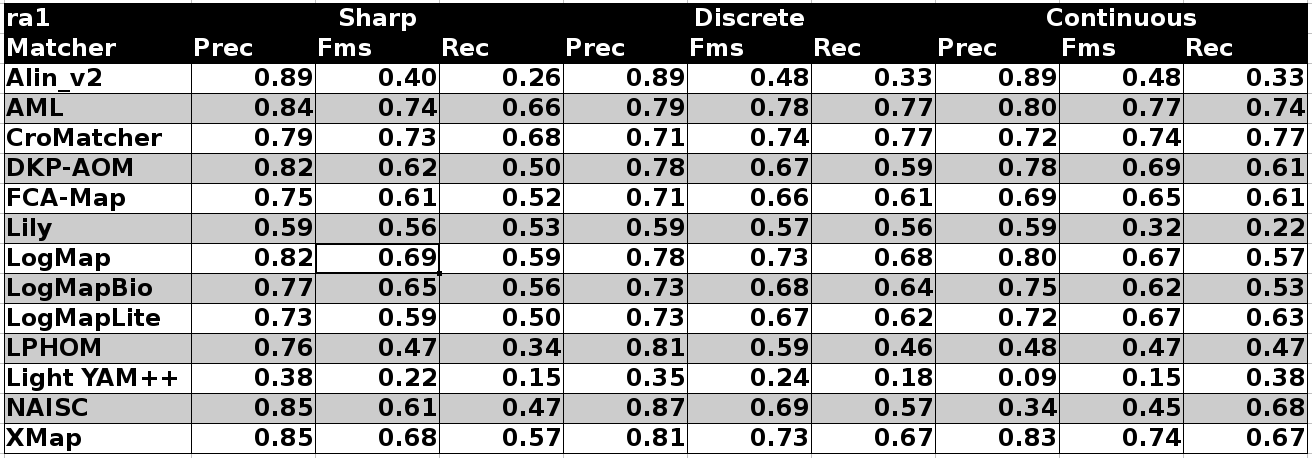
Out of the 13 alignment systems, three (DKP-AOM, FCA-Map and LogMapLite) use 1.0 as the confidence values for all matches they identify. Two of the remaining ten (Alin and CroMatcher) have some variation in confidence values, though the majority are 1.0. The rest of the systems have a fairly wide variation of confidence values. Last year, the majority of these values were near the upper end of the [0,1] range. This year we see much more variation in the average confidence values. For example, LopMap’s confidence values range from 0.29 to 1.0 and average 0.78 whereas Lily’s range from 0.22 to 0.41 and with an average of 0.33.
When comparing the performance of the matchers on the uncertain reference alignments versus that on the sharp version, we see that in the discrete case all matchers performed slightly better. Improvement in F-measure ranged from 1 to 8 percent over the sharp reference alignment. This was driven by increased recall, which is a result of the presence of fewer “controversial” matches in the uncertain version of the reference alignment.
The performance of most matchers is similar regardless of whether a discrete or continuous evaluation methodology is used (provided that the threshold is optimized to achieve the highest possible F-measure in the discrete case). The primary exceptions to this are Lily and NAISC. These systems perform significantly worse when evaluated using the continuous version of the metrics. In Lily’s case, this is because it assigns very low confidence values to some matches in which the labels are equivalent strings, which many crowdsourcers agreed with unless there was a compelling technical reason not to. This hurts recall, but using a low threshold value in the discrete version of the evaluation metrics “hides” this problem. NAISC has the opposite issue: it assigns relatively high confidence values to some matches that most people disagree with, such as “Assistant” and “Listener” (confidence value of 0.89). This hurts precision in the continuous case, but is taken care of by using a high threshold value (1.0) in the discrete case.
Seven systems from this year also participated last year, and thus we are able to make some comparisons over time. The F-measures of all systems either held constant or improved when evaluated against the uncertain reference alignments. Most systems made modest gains (in the neighborhood of 1 to 6 percent). CroMatcher made the largest improvement, and it is now the second-best system when evaluated in this way. AgreementMakerLight remains the top performer.
Perhaps more importantly, the difference in the performance of most systems between the discrete and continuous evaluation has shrunk between this year and last. This is an indication that more systems are providing confidence values that reflect the disagreement of humans on various matches.
For evaluation based on logical reasoning we applied detection of conservativity and consistency principles violations [2, 3]. While consistency principle proposes that correspondences should not lead to unsatisfiable classes in the merged ontology, conservativity principle proposes that correspondences should not introduce new semantic relationships between concepts from one of input ontologies [2].
Table below summarizes statistics per matcher. There are number of ontologies that have unsatisfiable TBox after ontologies merge (#Unsat.Onto), number of all alignments (#Align.), total number of all conservativity principle violations within all alignments (#TotConser.Viol.) and its average per one alignment (#AvgConser.Viol.), total number of all consistency principle violations (#TotConsist.Viol.) and its average per one alignment (#AvgConsist.Viol.).
Seven tools (Alin, AML, DKP-AOM, LogMap, LogMapBio, LPHOM and XMap) have no consistency principle violation (in comparison to five last year) and one tool (LYAM) generated only one incoherent alignment. There are two tools (Alin, LPHOM) having no conservativity principle violations. Further four tools have average of conservativity principle around 1 (XMap, LogMap, LogMapBio and DKP-AOM). We should note that these conservativity principle violations can be "false positives" since the entailment in the aligned ontology can be correct although it was not derivable in the single input ontologies.
| Matcher | #Unsat.Onto | #Align. | #Incoh.Align. | #TotConser.Viol. | #AvgConser.Viol. | #TotConsist.Viol. | #AvgConsist.Viol. |
|---|---|---|---|---|---|---|---|
| AML | 0 | 21 | 0 | 52 | 2.48 | 0 | 0 |
| Alin | 0 | 21 | 0 | 0 | 0 | 0 | 0 |
| CroMatch | 1 | 21 | 8 | 98 | 4.9 | 25 | 1.25 |
| DKPAOM | 0 | 21 | 0 | 35 | 1.67 | 0 | 0 |
| FCAMap | 0 | 21 | 12 | 46 | 2.19 | 150 | 7.14 |
| LPHOM | 0 | 21 | 0 | 0 | 0 | 0 | 0 |
| LYAM | 0 | 21 | 1 | 75 | 3.57 | 3 | 0.14 |
| Lily | 2 | 21 | 13 | 148 | 7.79 | 167 | 8.79 |
| LogMap | 0 | 21 | 0 | 30 | 1.43 | 0 | 0 |
| LogMapBio | 0 | 21 | 0 | 30 | 1.43 | 0 | 0 |
| LogMapLt | 0 | 21 | 6 | 99 | 4.71 | 81 | 3.86 |
| NAISC | 7 | 21 | 20 | 321 | 22.93 | 701 | 50.07 |
| XMap | 0 | 21 | 0 | 23 | 1.1 | 0 | 0 |
Here we list ten most frequent unsatisfiable classes appeared after ontologies merge by any tool. Six tools generated incoherent alignments.
cmt#PaperAbstract - 5
ekaw#Rejected_Paper - 4
ekaw#Regular_Paper - 4
ekaw#Poster_Paper - 4
ekaw#Industrial_Session - 4
ekaw#Evaluated_Paper - 4
ekaw#Contributed_Talk - 4
ekaw#Conference_Session - 4
ekaw#Camera_Ready_Paper - 4
ekaw#Accepted_Paper - 4
Here we list ten most frequent unsatisfiable classes appeared after ontologies merge by ontology pairs. These unsatisfiable classes were appeared in all ontology pairs for given ontology:
ekaw#Rejected_Paper - 6
ekaw#Evaluated_Paper - 6
ekaw#Contributed_Talk - 6
ekaw#Camera_Ready_Paper - 6
ekaw#Accepted_Paper - 6
edas#Reviewer - 6
cmt#Reviewer - 6
cmt#Review - 6
cmt#PaperFullVersion - 6
cmt#PaperAbstract - 6
Here we list ten most frequent caused new semantic relationships between concepts within input ontologies by any tool:
conference#Invited_speaker, http://conference#Conference_participant - 11
	conference-ekaw
ekaw#Invited_Talk, http://ekaw#Document - 10
	conference-ekaw
conference#Conference_proceedings, http://conference#Conference_document - 10
	conference-ekaw
iasted#Video_presentation, http://iasted#Item - 9
	conference-iasted
iasted#Video_presentation, http://iasted#Document - 9
	conference-iasted
iasted#Record_of_attendance, http://iasted#City - 9
	edas-iasted
iasted#Presentation, http://iasted#Item - 9
	conference-iasted
iasted#Presentation, http://iasted#Document - 9
	conference-iasted
iasted#PowerPoint_presentation, http://iasted#Item - 9
	conference-iasted
iasted#PowerPoint_presentation, http://iasted#Document - 9
	conference-iasted
Here we list ten most frequent caused new semantic relationships between concepts within input ontologies by ontology pairs:
conference#Regular_contribution, http://conference#Extended_abstract - 4
	Lily
	FCAMap
	NAISC
conference#Reviewed_contribution, http://conference#Regular_contribution - 3
	CroMatch
	Lily
	AML
	NAISC
conference#Rejected_contribution, http://conference#Regular_contribution - 3
	CroMatch
	Lily
	AML
	NAISC
conference#Conference_contribution, http://conference#Written_contribution - 3
	CroMatch
	NAISC
conference#Camera_ready_contribution, http://conference#Regular_contribution - 3
	CroMatch
	LogMap
	AML
	XMap
	LogMapBio
conference#Accepted_contribution, http://conference#Regular_contribution - 3
	CroMatch
	LogMap
	AML
	NAISC
	LogMapBio
	Lily
sigkdd#Review, http://sigkdd#Person - 2
	FCAMap
sigkdd#Registration_fee, http://sigkdd#Committee - 2
	NAISC
sigkdd#Registration_Student, http://sigkdd#Person - 2
	CroMatch
sigkdd#Registration_Non-Member, http://sigkdd#Committee - 2
	NAISC
We would like to thank to Alessandro Solimando for his help with running the code for logical reasoning based evaluation.
[1] Michelle Cheatham, Pascal Hitzler: Conference v2.0: An Uncertain Version of the OAEI Conference Benchmark. International Semantic Web Conference (2) 2014: 33-48.
[2] Alessandro Solimando, Ernesto Jiménez-Ruiz, Giovanna Guerrini: Detecting and Correcting Conservativity Principle Violations in Ontology-to-Ontology Mappings. International Semantic Web Conference (2) 2014: 1-16.
[3] Alessandro Solimando, Ernesto Jiménez-Ruiz, Giovanna Guerrini: A Multi-strategy Approach for Detecting and Correcting Conservativity Principle Violations in Ontology Alignments. OWL: Experiences and Directions Workshop 2014 (OWLED 2014). 13-24.
[4] Svab O., Svatek V., Berka P., Rak D., Tomasek P.: OntoFarm: Towards an Experimental Collection of Parallel Ontologies. In: Poster Track of ISWC 2005, Galway.