
We have run the evaluation in a Ubuntu Laptop with an Intel Core i7-4600U CPU @ 2.10GHz x 4 and allocating 15Gb of RAM.
Systems have been evaluated according to the following criteria:
In the OAEI 2016 phenotype track 11 out of 21 participating OAEI 2016 systems have been able to cope with at least one of the tasks with a 24 hours timeout.
LogMapBio uses BioPortal as mediating ontology provider, that is, it retrieves from BioPortal the most suitable top-10 ontologies for the matching task.
LogMap uses normalisations and spelling variants from the general (biomedical) purpose UMLS Lexicon.
AML has three sources of background knowledge which can be used as mediators between the input ontologies: the Uber Anatomy Ontology (Uberon), the Human Disease Ontology (DOID) and the Medical Subject Headings (MeSH).
XMAP uses synonyms provided by the UMLS Metathesaurus.
PhenoMM, PhenoMF and PhenoMP rely on different versions of the PhenomeNET ontology with variable complexity.
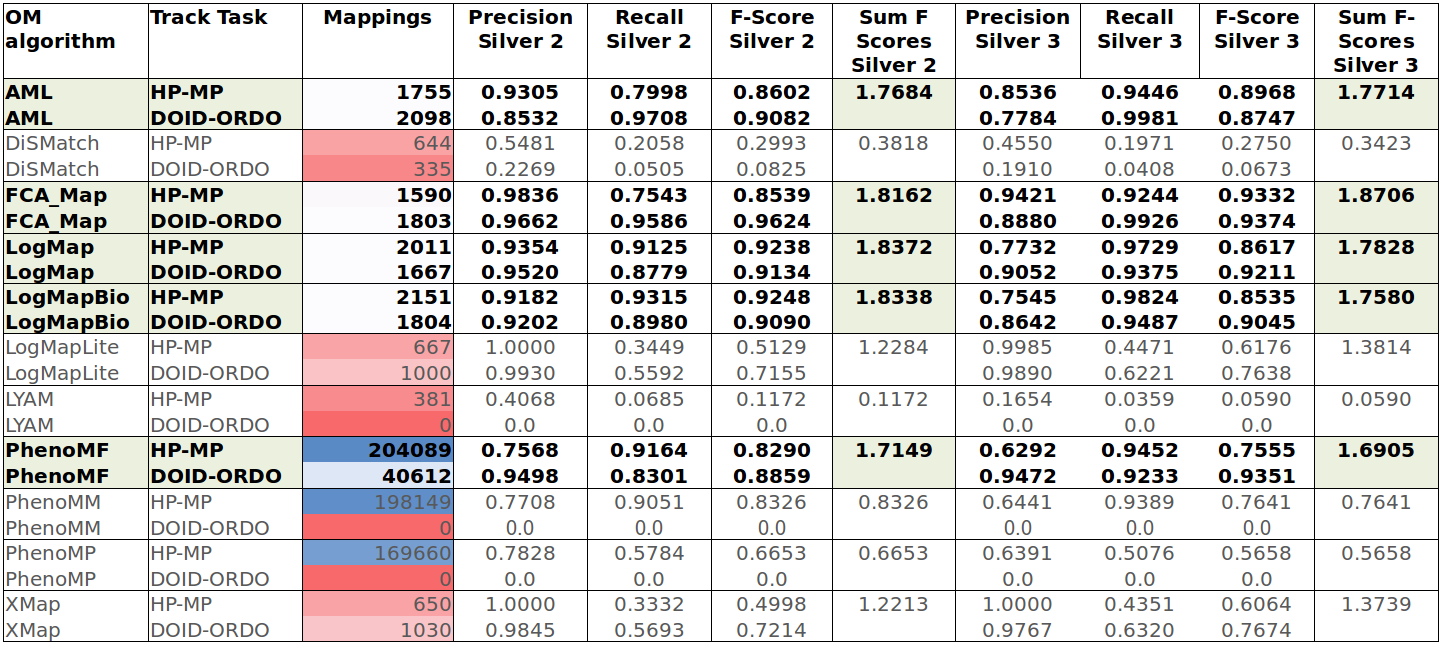
1. Results against the silver standard with vote 2 and 3
The silver standards for HP-MP with vote 2 and 3 contain 2,308 and 1,588 mappings, respectively; while for DOID-ORDO they include 1,883 and 1,617 mappings respectively. Table 1 shows the results achieved by each of the participating systems. We did not rank the systems on purpose since the silver standards only give a reference about how good you are with respect to the others. For example, 5 of the systems (the highlighted ones) produce results relatively close to the silver standards. For example, LogMap is the system closer to the mappings voted by at least 2 systems, while FCA-MAP produces results very close to the silver standard with vote 3.
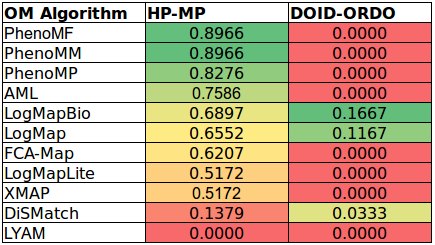
2. Results against manually created mappings
The manually generated mappings for three areas (carbohydrate, obesity and breast cancer) include 29 mappings between HP and MP and 60 mappings between DOID and ORDO. Most of them representing subsumption relationships. Table 2 shows the results in terms of recall for each of the systems. PhenoMF, PhenoMP and PhenoMM achieve very good results for HP-MP since they discover a large number of subsumption mappings. However, for DOID-ORDO only LogMap, LogMapBio and DisMatch discover some of the mappings in the curated set.
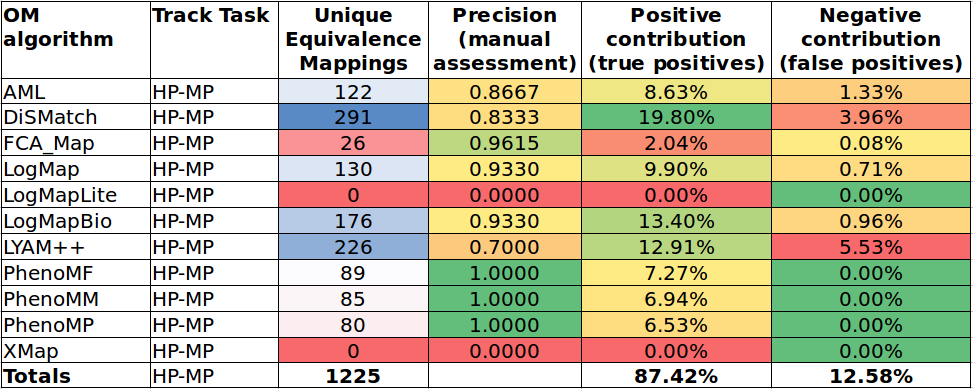
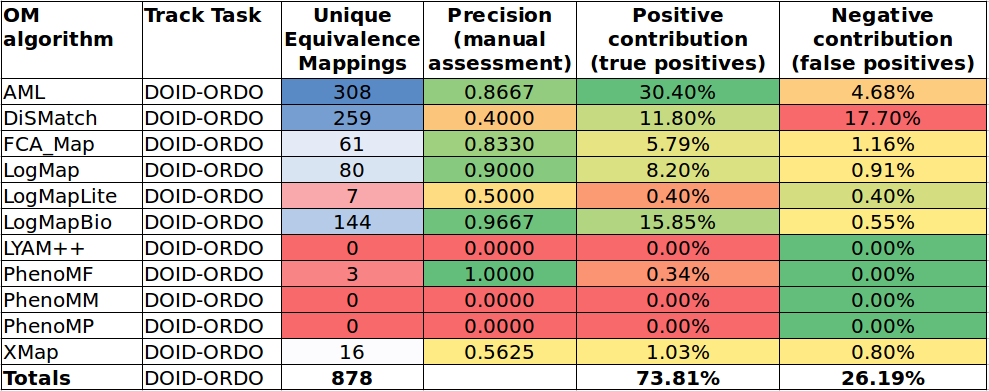
3. Manual assessment of unique mappings
Tables 3 and 4 show the results of the manual assessment (i.e. precision) of the unique mappings generated by the participating systems. Unique mappings are correspondences that no other system (explicitly) provided in the output. We manually evaluated up to 30 mappings and we focused the assessment on unique equivalence mappings.
For example DiSMatch output contains 291 unique mappings in the HP-MP task. The manual assessment revealed an (estimated) precision of 0.8333. In order to also take into account the number of unique mappings that a system is able to discover, Tables 3 and 4 also include the positive and negative contribution of the unique mappings with respect to the total unique mappings discovered by all participating systems.
4. Winners of the Prize! 
AML, FCA-Map, LogMap, LogMapBio and PhenoMF produced the most complete results according to both the automatic and manual evaluation. LogMap and LogMapBio were not selected for the prize since Ernesto is one of the developers and he is also co-organising this track.
The winners of the prize sponsored by the Pistoia Alliance were (in alphabetic order): AML, FCA-Map and PhenoMF. Each of them got $2,500, CONGRATULATIONS!