
Five systems enrolled in the Complex track: AML, AMLC, AROA, CANARD and Lily. We also evaluated other systems: AGM, Alin, AML, DOME, FCAMap-KG, LogMap, LogMapKG, LogMapLt, ONTMAT1, POMAP++, Wiktionary.
The systems were run on the Original Conference dataset and on the Populated version of the Conference dataset. Their output alignments were evaluated as described below.
The results of the systems on the Original Conference dataset and on the Populated Conference dataset are described in this page.
For each system, the best set of alignments are kept for the final result of this track. For example, if a system performs better on the Original Conference dataset than on the Populated Conference dataset, then the results on the Original Conference dataset are kept as result of this track.
The systems have been executed on a Ubuntu 16.04 machine configured with 16GB of RAM running under a i7-4790K CPU 4.00GHz x 8 processors. All measurements are based on a single run.
In this subtrack, the alignments are automatically evaluated over a populated version of the Conference dataset. The dataset as well as the evaluation systems are available at https://framagit.org/IRIT_UT2J/conference-dataset-population. Two metrics are computed: a Coverage score and a Precision score.
The Coverage and Precision are based on a set of scoring functions between two instance sets Iref and Ieval
For the Coverage score calculation, the reference is a set of pairs of equivalent SPARQL queries (Competency Questions for Alignment (CQAs)), one over the source ontology, one over the target ontology. The source reference CQA is rewritten using the evaluated alignment and its instances are compared to those of the target reference CQA.
Different Coverage scores are output depending on the comparison between the instance sets presented above. As in the following equation where SKB is the source knowledge base, TKB the target knowledge base, cqa_pairs the set of pairs of correspondences, f a scoring function in {classical, query Fmeasure} and A the evaluated alignment.
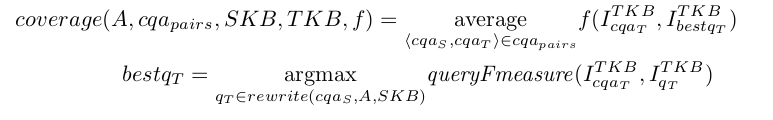
The Precision score is calculated by comparing the instances represented by the source member with the instances represented by the target member of each correspondence. The following equation shows how the Precision is calculated. SKB is the source knowledge base, TKB the target knowledge base, f a scoring function in {classical, query Fmeasure, not disjoint} and A the evaluated alignment.
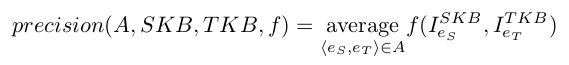
As a set of instances from the source knowledge base are compared to a set of instances from the target knowledge base, this score is not absolute, even though the knowledge bases are populated with similar instances (because the ontologies' scopes are not always exactly equivalent). The percentage of correct correspondences is somewhere between the Precision with a classical scoring function and the not disjoint scoring function.
The output alignments as well as the detailed results of the systems over the Original Conference dataset are downloadable here.
The matchers were run on the original Conference dataset. The output alignments are evaluated with the system presented above.
Number of correspondence output per tool per type over the original dataset and runtime
| tool | (1:1) | (1:n) | (m:1) | (m:n) | total | Runtime (s) |
|---|---|---|---|---|---|---|
| ra1 | 348 | 0 | 0 | 0 | 348 | |
| Alin | 162 | 0 | 0 | 0 | 162 | 176 |
| AML | 274 | 0 | 0 | 0 | 274 | 20 |
| AMLC | 0 | 115 | 115 | 0 | 230 | 122 |
| DOME | 210 | 0 | 0 | 0 | 210 | 34 |
| FCAMap-KG | 228 | 0 | 0 | 0 | 228 | 15 |
| Lily | 298 | 0 | 0 | 0 | 298 | 60 |
| LogMap | 248 | 0 | 0 | 0 | 248 | 23 |
| LogMapKG | 248 | 0 | 0 | 0 | 248 | 22 |
| LogMapLt | 244 | 0 | 0 | 0 | 244 | 13 |
| ONTMAT1 | 162 | 0 | 0 | 0 | 162 | 64 |
| POMAP++ | 568 | 0 | 0 | 0 | 568 | 25 |
| Wiktionary | 274 | 0 | 0 | 0 | 274 | 34 |
Results over the Original Conference dataset
| Precision | Coverage | ||||
|---|---|---|---|---|---|
| tool | classical | query Fmeasure | not disjoint | classical | query Fmeasure |
| ra1 | 0.563 | 0.816 | 0.967 | 0.372 | 0.409 |
| Alin | 0.678 | 0.856 | 0.976 | 0.201 | 0.282 |
| AML | 0.587 | 0.812 | 0.932 | 0.305 | 0.372 |
| AMLC | 0.297 | 0.392 | 0.59 | 0.461 | 0.502 |
| DOME | 0.589 | 0.767 | 0.945 | 0.226 | 0.306 |
| FCAMap-KG | 0.512 | 0.67 | 0.825 | 0.203 | 0.284 |
| Lily | 0.448 | 0.619 | 0.729 | 0.229 | 0.287 |
| LogMap | 0.564 | 0.788 | 0.964 | 0.248 | 0.324 |
| LogMapKG | 0.564 | 0.788 | 0.964 | 0.248 | 0.324 |
| LogMapLt | 0.497 | 0.677 | 0.872 | 0.227 | 0.312 |
| ONTMAT1 | 0.669 | 0.849 | 0.976 | 0.196 | 0.279 |
| POMAP++ | 0.248 | 0.306 | 0.541 | 0.19 | 0.259 |
| Wiktionary | 0.491 | 0.682 | 0.88 | 0.261 | 0.344 |
The output alignments as well as the detailed results of the systems over the Original Conference dataset are downloadable here.
The matchers were then run on a populated version of the conference dataset.
Number of correspondence output per tool per type over the Populated dataset
| tool | (1:1) | (1:n) | (m:1) | (m:n) | instance | total | filtered | Runtime (s) | Runtime (min) |
|---|---|---|---|---|---|---|---|---|---|
| AGM | 0 | 0 | 0 | 0 | 5466 | 5466 | 0 | 2,319 | 39 |
| Alin | 114 | 0 | 0 | 0 | 0 | 114 | 114 | 839 | 14 |
| AML | 245 | 0 | 0 | 0 | 1384773 | 1385018 | 245 | 3,293 | 55 |
| AMLC | 0 | 115 | 115 | 0 | 0 | 230 | 230 | 128 | 2 |
| CANARD | 388 | 1142 | 8 | 64 | 0 | 1602 | 1602 | 5,733 | 96 |
| DOME | 124 | 0 | 0 | 0 | 3529 | 3653 | 124 | 493 | 8 |
| FCAMap-KG | 228 | 0 | 0 | 0 | 32308 | 32536 | 228 | 312 | 5 |
| LogMap | 249 | 0 | 0 | 0 | 0 | 249 | 249 | 321 | 5 |
| LogMapKG | 249 | 0 | 0 | 0 | 7036 | 7285 | 249 | 344 | 6 |
| LogMapLt | 244 | 0 | 0 | 0 | 36718 | 36962 | 244 | 308 | 5 |
| ONTMAT1 | 162 | 0 | 0 | 0 | 0 | 162 | 162 | 368 | 6 |
| POMAP++ | 701 | 0 | 0 | 0 | 5 | 706 | 701 | 611 | 10 |
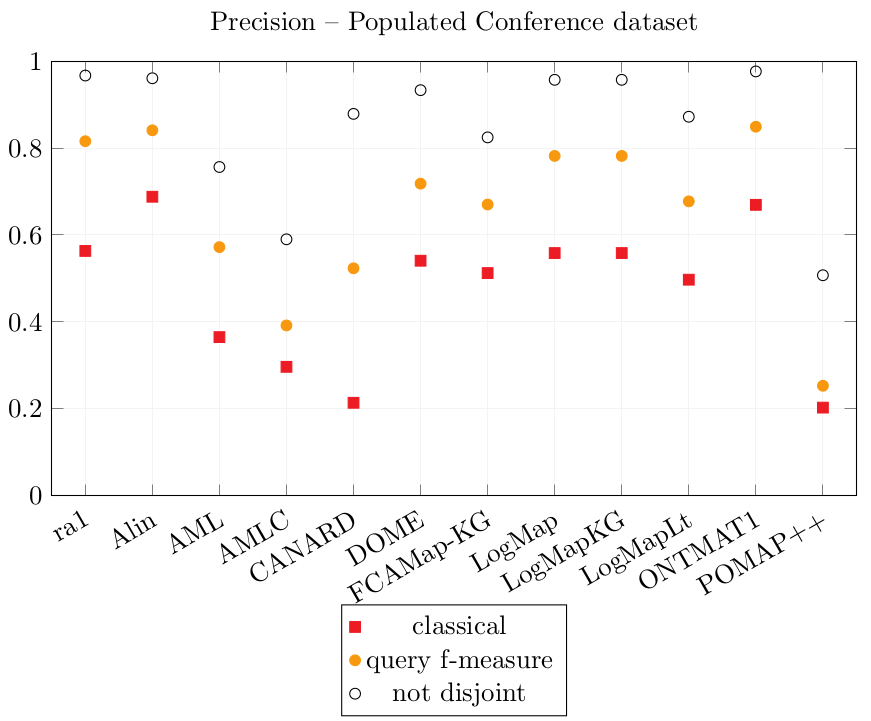
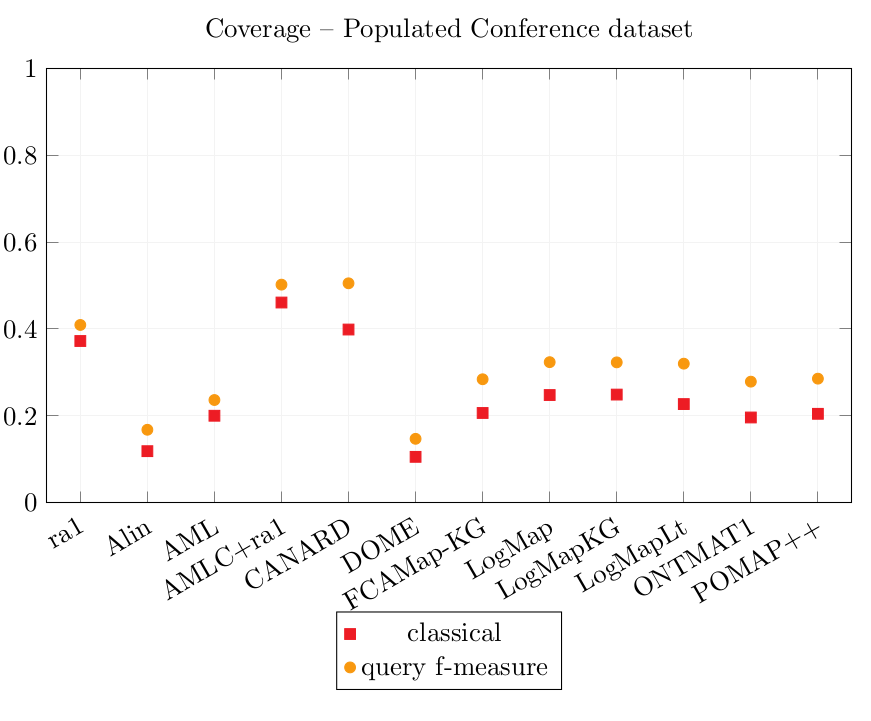
Results over the Populated Conference dataset.
| Precision | Coverage | ||||
|---|---|---|---|---|---|
| tool | classical | query Fmeasure | not disjoint | classical | query Fmeasure |
| ra1 | 0.563 | 0.816 | 0.967 | 0.372 | 0.409 |
| Alin | 0.688 | 0.841 | 0.961 | 0.119 | 0.168 |
| AML | 0.365 | 0.572 | 0.756 | 0.200 | 0.237 |
| AMLC | 0.297 | 0.392 | 0.590 | 0.461 | 0.502 |
| CANARD | 0.214 | 0.523 | 0.879 | 0.399 | 0.505 |
| DOME | 0.541 | 0.718 | 0.933 | 0.106 | 0.147 |
| FCAMap-KG | 0.512 | 0.670 | 0.825 | 0.207 | 0.284 |
| LogMap | 0.558 | 0.782 | 0.957 | 0.248 | 0.324 |
| LogMapKG | 0.558 | 0.782 | 0.957 | 0.249 | 0.323 |
| LogMapLt | 0.497 | 0.677 | 0.872 | 0.227 | 0.320 |
| ONTMAT1 | 0.669 | 0.849 | 0.976 | 0.196 | 0.279 |
| POMAP++ | 0.203 | 0.253 | 0.507 | 0.205 | 0.286 |
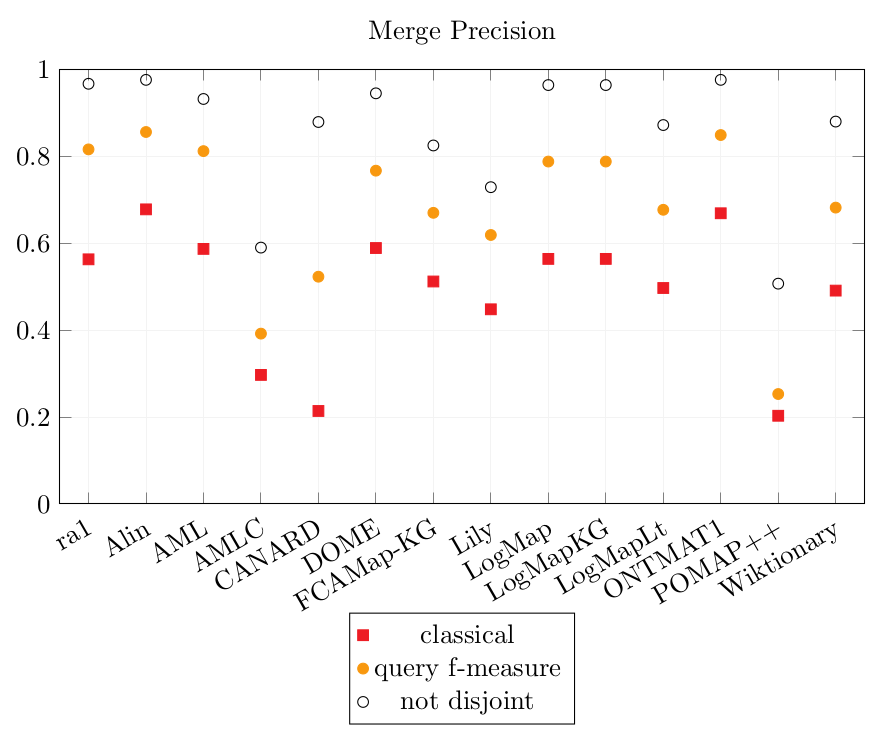
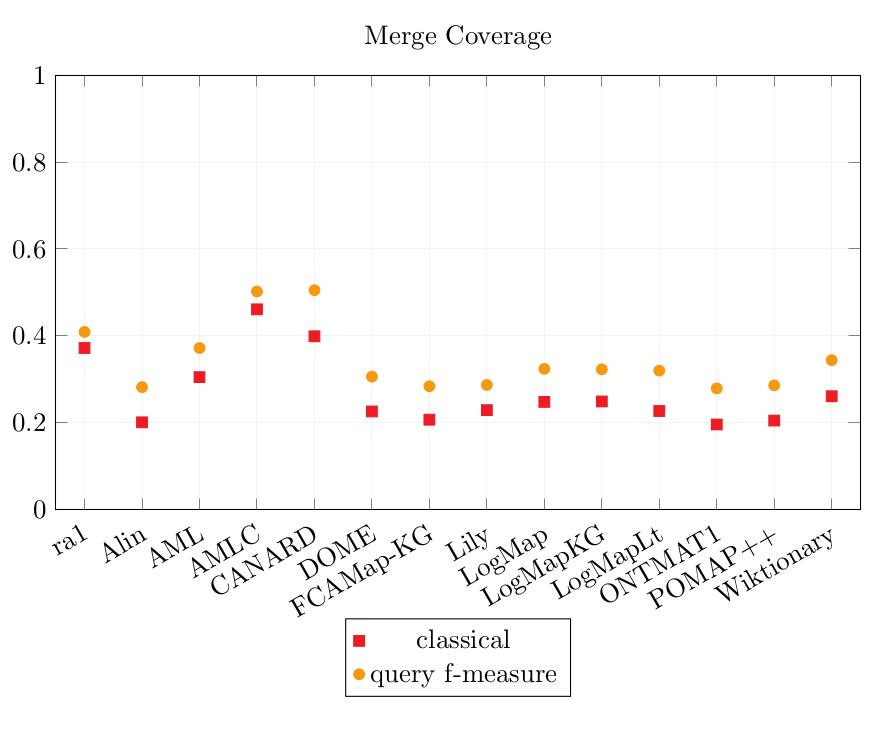
The results of the systems over the two versions of the Conference dataset are merged here to show on which dataset they performed the best and to compare their results. The sets of output alignments were chosen for the best CQA scores, and if their CQA scores are identical on both datasets, the one with the best Precision scores is chosen.
Merged results.
The dataset from which these results come from are specified after the name of the tool as (orig): Original Conference dataset, (pop): Populated Conference dataset, (=): if the alignments and results are identical for both datasets.
| Precision | Coverage | ||||
|---|---|---|---|---|---|
| tool | classical | query Fmeasure | not disjoint | classical | query Fmeasure |
| ra1 | 0.563 | 0.816 | 0.967 | 0.372 | 0.409 |
| Alin (orig) | 0.678 | 0.856 | 0.976 | 0.201 | 0.282 |
| AML (orig) | 0.587 | 0.812 | 0.932 | 0.305 | 0.372 |
| AMLC (=) | 0.297 | 0.392 | 0.590 | 0.461 | 0.502 |
| CANARD (pop) | 0.214 | 0.523 | 0.879 | 0.399 | 0.505 |
| DOME (orig) | 0.589 | 0.767 | 0.945 | 0.226 | 0.306 |
| FCAMap-KG (pop) | 0.512 | 0.670 | 0.825 | 0.207 | 0.284 |
| Lily (orig) | 0.448 | 0.619 | 0.729 | 0.229 | 0.287 |
| LogMap (orig) | 0.564 | 0.788 | 0.964 | 0.248 | 0.324 |
| LogMapKG (pop) | 0.564 | 0.788 | 0.964 | 0.248 | 0.324 |
| LogMapLt (pop) | 0.497 | 0.677 | 0.872 | 0.227 | 0.320 |
| ONTMAT1 (=) | 0.669 | 0.849 | 0.976 | 0.196 | 0.279 |
| POMAP++ (pop) | 0.203 | 0.253 | 0.507 | 0.205 | 0.286 |
| Wiktionary (orig) | 0.491 | 0.682 | 0.880 | 0.261 | 0.344 |
The runtime of the systems is overall higher on the Populated Conference dataset than over the Original Conference dataset.
Over the Populated Conference dataset, some tools output instance correspondences: AML, DOME, FCAMap-KG, LogMapKG, LogMapLt, POMAP++. CANARD has the longest runtime of all systems. POMAP++ has the particularity that it output many correspondences which linked a Class to an instance. For example (conference:Paid applicant , ekaw-instances:topic180098146 , ≡) was output by POMAP++. AGM was only able to output correspondences between instances. On the pairs involving the conference ontology, AML only output instance correspondences. For the Precision score, the instance correspondences were removed from the alignments.
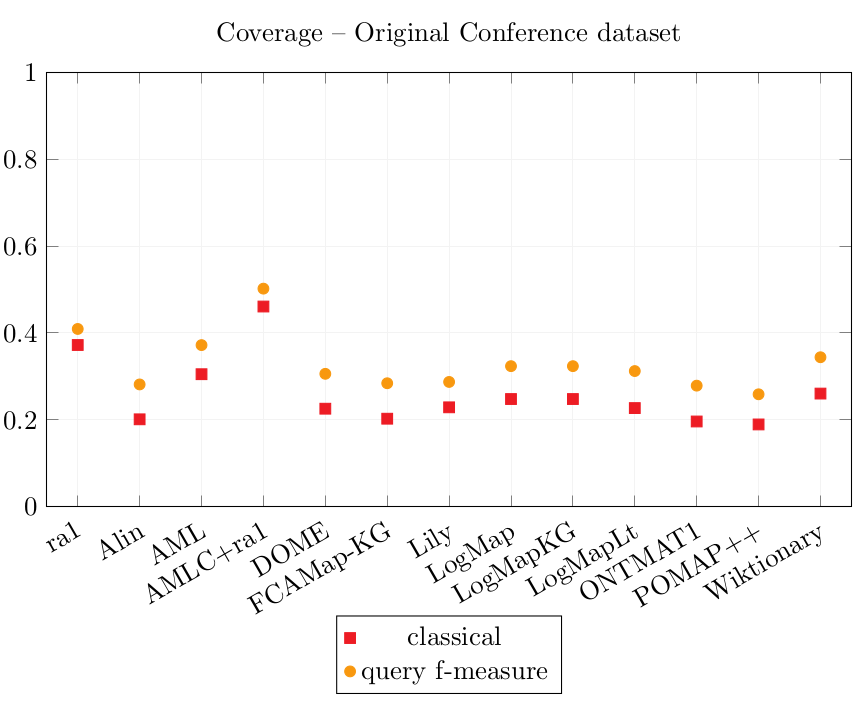
The simple reference alignment ra1 obtains better Coverage scores than all simple alignment systems. The systems which generate complex alignments get better Coverage scores. AMLC put together with ra1 enables to rewrite the most CQAs with equivalent queries: it has the best classical Coverage score (0.46). CANARD obtains a classical Coverage score of 0.40 while ra1 obtains 0.37.
The query Fmeasure Coverage score represents how well the CQAs are covered, even though all results are not exactly equivalent. For example, if a rewritten query retrieves 99 instances over the 100 expected ones, the query Fmeasure score is 0.99 (cf. Equation 3). CANARD obtains the best query Fmeasure Coverage score (0.505), followed very closely by AMLC+ra1 (0.502), while ra1 alone 0.409.
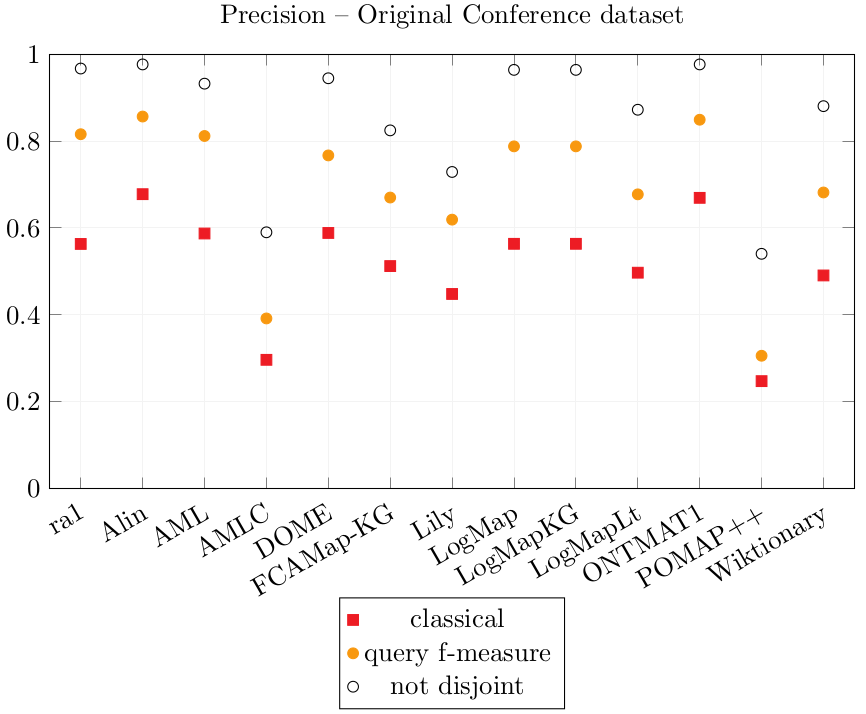
ra1 obtains a 0.97 not disjoint Precision score because the interpretation of the ontologies during their population changed a little from that of ra1. (e.g., (conference:Poster , ekaw:Poster Paper , ≡ ) and ( conference:Poster , confOf:Poster , ≡ ) are not correct anymore because conference:Poster was considered to be the actual poster object in the population, and not a poster paper). The Precision and Coverage scores of AML and DOME are lower on the Populated Conference dataset than on the Original dataset. The Coverage scores of Alin are lower on the Populated Conference dataset because it encountered errors over the pairs with the cmt ontology.
The simple reference alignment ra1 obtains the best of the simple alignments Coverage scores overall (classical 0.37, query Fmeasure 0.41). AML has the best Coverage scores (classical 0.31, query Fmeasure 0.37) of the simple alignment systems followed by Wiktionary (classical 0.26, query Fmeasure 0.34). AMLC improves the Coverage of ra1 which it includes (classical 0.46, query Fmeasure 0.50).
Alin, AML, DOME, LogMap, LogMapKG, ONTMAT1 obtain Precision scores similar to ra1’s which leads to think that most of their correspondences are correct. The Precision scores of POMAP++ is overall the lowest and AMLC (only the complex output correspondences) comes second last.