
We have seen fourteen participants:
You can download all alignments delivered by participants. They are in one directory conference11 named as it follows: matcher-ontology1-ontology2.rdf.
This year we considered results of participants with the following evaluation methods:
We have 21 reference alignments, which corresponds to the complete alignment space between 7 ontologies from the data set. You can download this reference alignment. Please let us know how you use this reference alignment and data set (ondrej.zamazal at vse dot cz).
![The highest F_[1|2|0.5]$measure and their corresponding precision and recall for some threshold for each matcher.](optimalTable1.png)
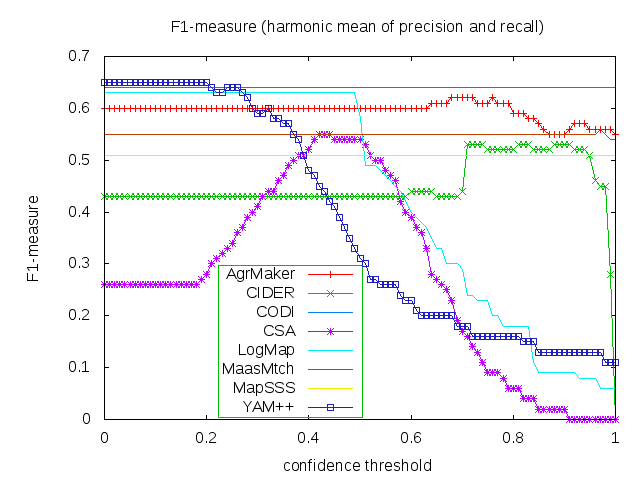
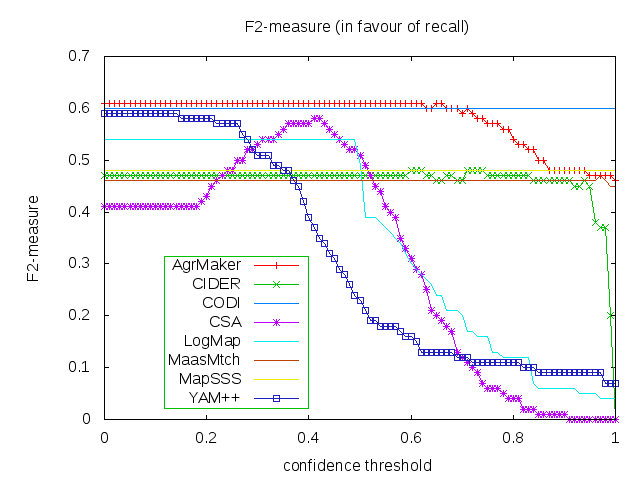
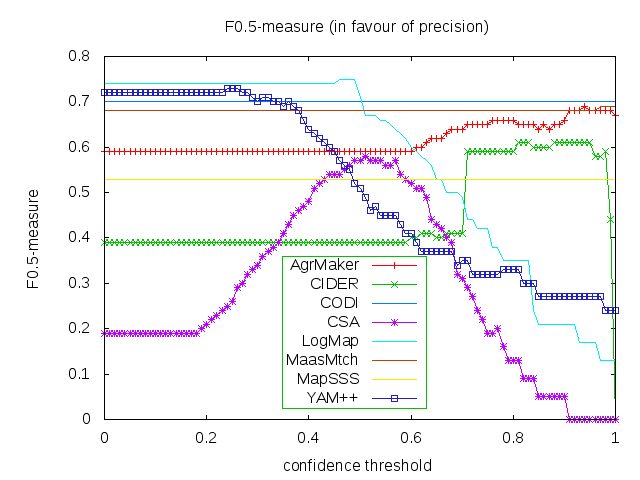
For better comparison, we evaluated matchers alignments with regard to three different average (an average is calculated using absolute scores, i.e. number of true positive examples etc.) F-measures independently for each F-measure. We used F_0.5-measure (where beta=0.5) which weights precision higher than recall, F_1-measure (where beta=1), which is the harmonic mean of precision and recall, and F_2-measure (for beta=2) which weights recall higher than precision. For each of those average F-measures we selected a global confidence threshold (F-measures dependence on confidence threshold can be seen from three graphs below) that provides the highest average F_[0.5|1|2]-measure. Results of those three independent evaluations (i.e. precision and recall can be different in all three cases) are provided in Table above.
Matchers are ordered according to their highest average F_1-measure. Additionally, there are two simple string matchers as baselines. Baseline_1 is a string matcher based on string equality applied on local names of entities which were lowercased before. Baseline_2 enhanced baseline_1 with three string operations: removing of dashes, underscore and 'has' words from all local names. These two baselines divide matchers into four groups. Group 1 consists of best matchers (YAM++, CODI, LogMap and AgrMaker) having better results than baseline_2 in terms of average F_1-measure. Matchers which perform worse than baseline_2 in terms of average F_1-measure but still better than baseline_1 are in Group 2 (MaasMtch). Group 3 (CSA, CIDER and MapSSS) contains matchers which are better than baseline_1 at least in terms of average F_2-measure. Other the matchers (Lily, AROMA-, Optima, MapPSO, LDOA and MapEVO) perform worse than baseline_1 (Group 4). The dependency of F_1-measure, F_2-measure and F_0.5-measure on the confidence threshold for first eight matchers (excluding baselines matchers) can be seen from the figures below. Optima, MapSSS and CODI did not provide graded confidence values.
Performance of matchers regarding an average F_1-measure is visualized in the figure below where matchers of participants from first three groups are represented as squares. Baselines are represented as circles. Horizontal line depicts level of precision/recall while values of average F_1-measure are depicted by areas bordered by corresponding lines F_1-measure=0.[5|6|7].
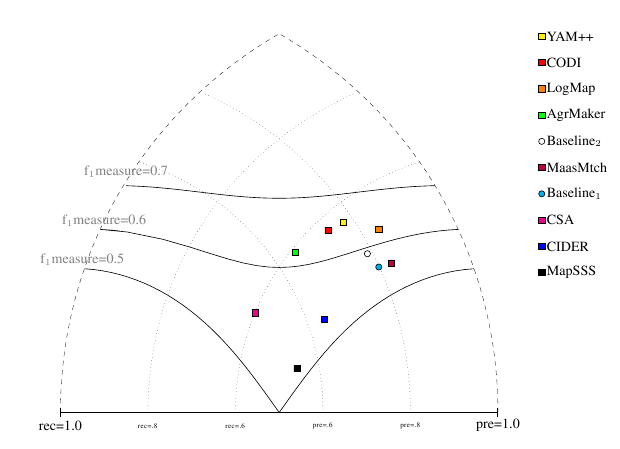
In conclusion, all best matchers (group one) are very close to each other. However, the matcher with the highest average F_1-measure (.65) is YAM++, the highest average F_2-measure (.61) has AgreementMaker and the highest average F_0.5-measure (.75) has LogMap. In any case, we should take into account that this evaluation has been made over a subset of all possible alignments (one fifth).
Three matchers also participated in the previous year. AgreementMaker improved its average F_1-measure from .58 to .62 by higher precision (from .53 to .65) and lower recall (from .62 to .59), CODI increased its average F_1-measure from .62 to .64 by higher recall (from .48 to .57) and lower precision (from .86 to .74). AROMA (with its AROMA- variant) slightly decreased its average F_1-measure from .42 to .40 by lower precision (from .36 to .35) and recall (from .49 to .46).
This method has been done by Christian Meilicke from Computer Science Institure at University Mannheim, Germany.
Results are available in [1].
We would like to thank to Christian Meilicke for his help with creation of precision/recall triangular graph and his "evaluation based on logical reasoning".
Contact address is Ondřej Šváb-Zamazal (ondrej.zamazal at vse dot cz).
[1] Euzenat J. et al.: Results of the Ontology Alignment Evaluation Initiative 2011.