
Web page content
This year we have 10 participants (ALIN, AML, KEPLER, LogMap, LogMapLt, ONTMAT, POMap, SANOM, WikiV3 and XMap) which managed to generate meaningful output. Other matchers did not generate any alignments (those matchers focusing on instance matching or on biomedical ontologies) except LogMapBio which output is almost identical to LogMap for this track; we only used LogMap. We also provide comparison with tools that participated in previous years of OAEI in terms of highest average F1-measure.
You can download a subset of all alignments for which there is a reference alignment. In this case we provide alignments as generated by the SEALS platform (afterwards we applied some tiny modifications which we explained below). Alignments are stored as it follows: matcher-ontology1-ontology2.rdf.
Tools have been evaluated based on
We have three variants of crisp reference alignments (the confidence values for all matches are 1.0). They contain 21 alignments (test cases), which corresponds to the complete alignment space between 7 ontologies from the OntoFarm data set. This is a subset of all ontologies within this track (16) [4], see OntoFarm data set web page.
For each reference alignment we provide three evaluation variants
rar2 M3 is used as the main reference alignment for this year. It will also be used within the synthesis paper.
| ra1 | ra2 | rar2 | |
| M1 | ra1-M1 | ra2-M1 | rar2-M1 |
| M2 | ra1-M2 | ra2-M2 | rar2-M2 |
| M3 | ra1-M3 | ra2-M3 | rar2-M3 |
Regarding evaluation based on reference alignment, we first filtered out (from alignments generated using SEALS platform) all instance-to-any_entity and owl:Thing-to-any_entity correspondences prior to computing Precision/Recall/F1-measure/F2-measure/F0.5-measure because they are not contained in the reference alignment. In order to compute average Precision and Recall over all those alignments we used absolute scores (i.e. we computed precision and recall using absolute scores of TP, FP, and FN across all 21 test cases). This corresponds to micro average precision and recall. Therefore, the resulting numbers can slightly differ with those computed by the SEALS platform (macro average precision and recall). Then, we computed F1-measure in a standard way. Finally, we found the highest average F1-measure with thresholding (if possible).
In order to provide some context for understanding matchers performance we included two simple string-based matchers as baselines. StringEquiv (before it was called Baseline1) is a string matcher based on string equality applied on local names of entities which were lowercased before (this baseline was also used within anatomy track 2012) and edna (string editing distance matcher) was adopted from benchmark track (wrt. performance it is very similar to the previously used baseline2).
In the tables below, there are results of all 10 tools with regard to all combinations of evaluation variants with crisp reference alignments. There are precision, recall, F1-measure, F2-measure and F0.5-measure computed for the threshold that provides the highest average F1-measure computed for each matcher. F1-measure is the harmonic mean of precision and recall. F2-measure (for beta=2) weights recall higher than precision and F0.5-measure (for beta=0.5) weights precision higher than recall.
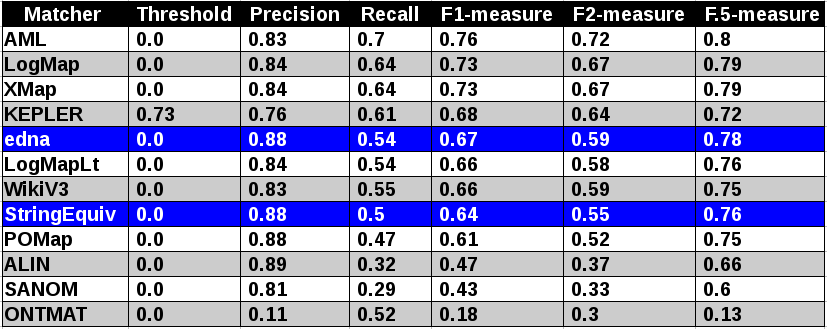
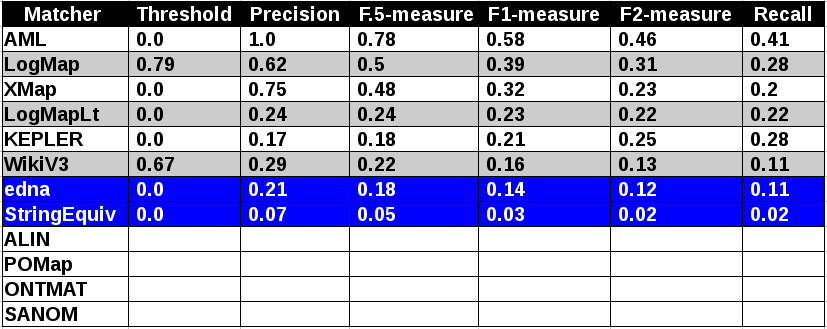
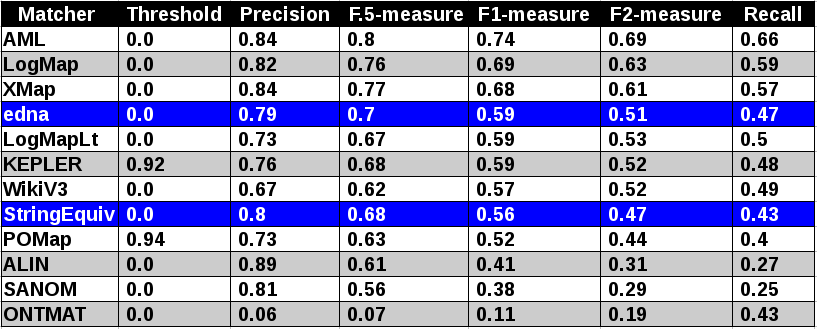
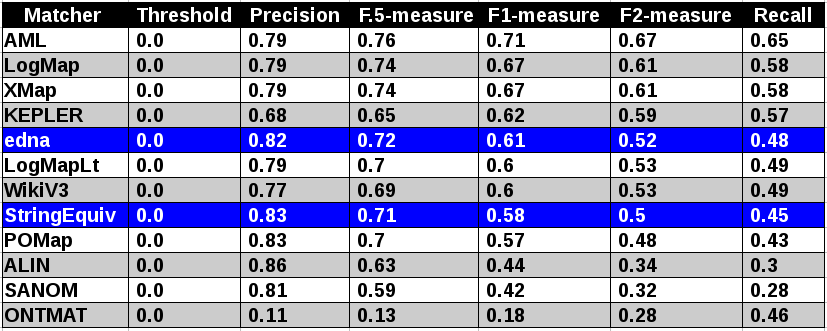
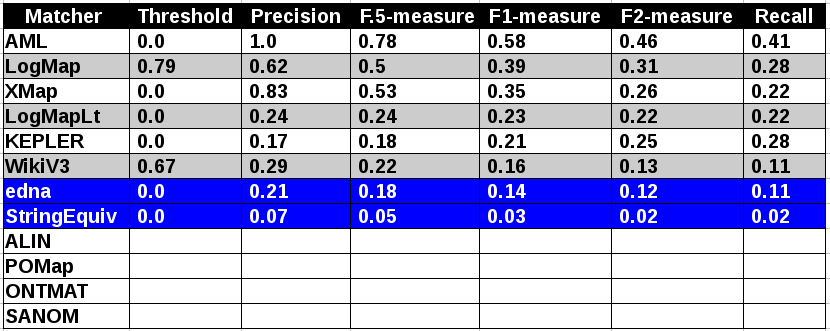
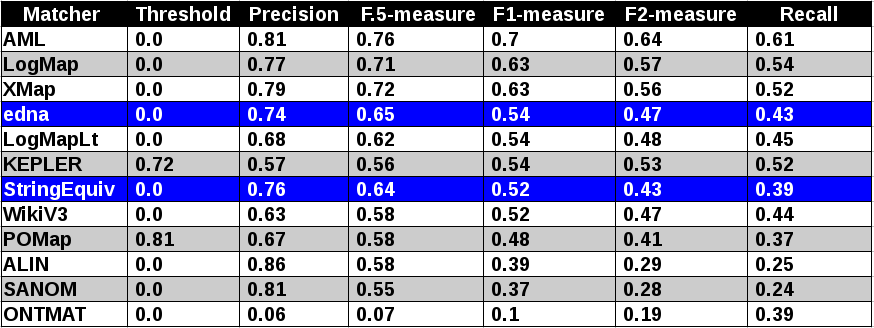
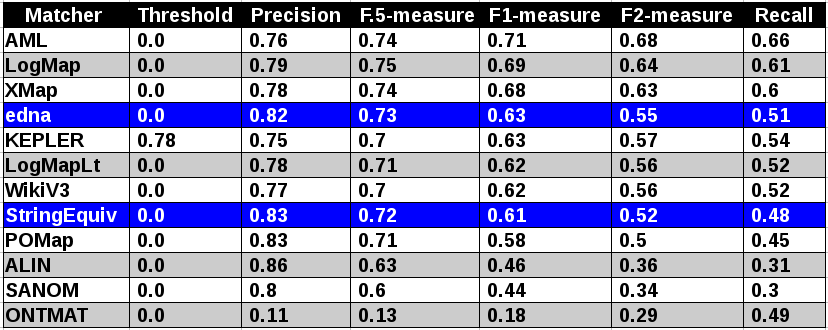
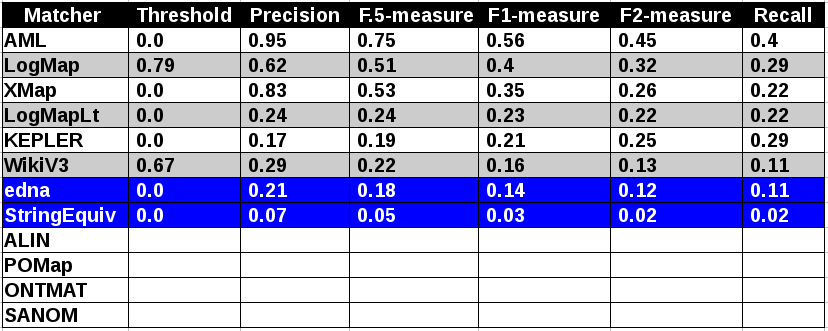
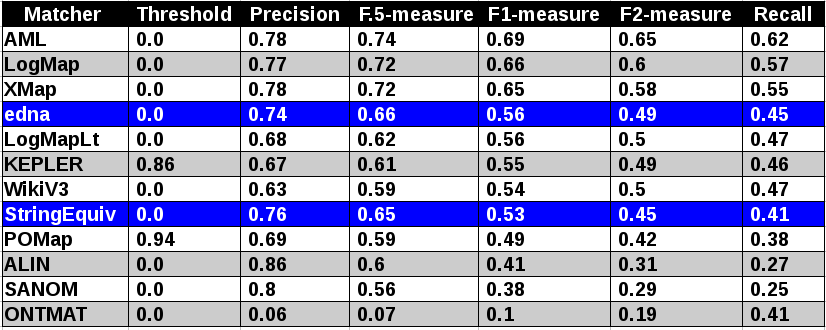
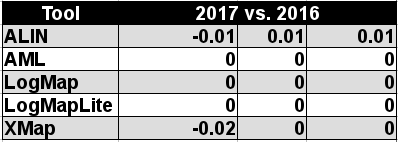
Table below summarizes performance results of tools participated last 2 years of OAEI, conference track with regard to reference alignment rar2.
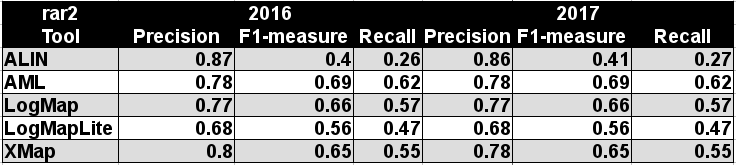
Based on this evaluation we can see that five matching tools participated in the previous year did not change the results.
All tools except ONTMAT (precision and recall were below 0.5) are visualized in terms of their performance regarding an average F1-measure in the figure below. Tools are represented as squares or triangles. Baselines are represented as circles. Horizontal line depicts level of precision/recall while values of average F1-measure are depicted by areas bordered by corresponding lines F1-measure=0.[5|6|7].
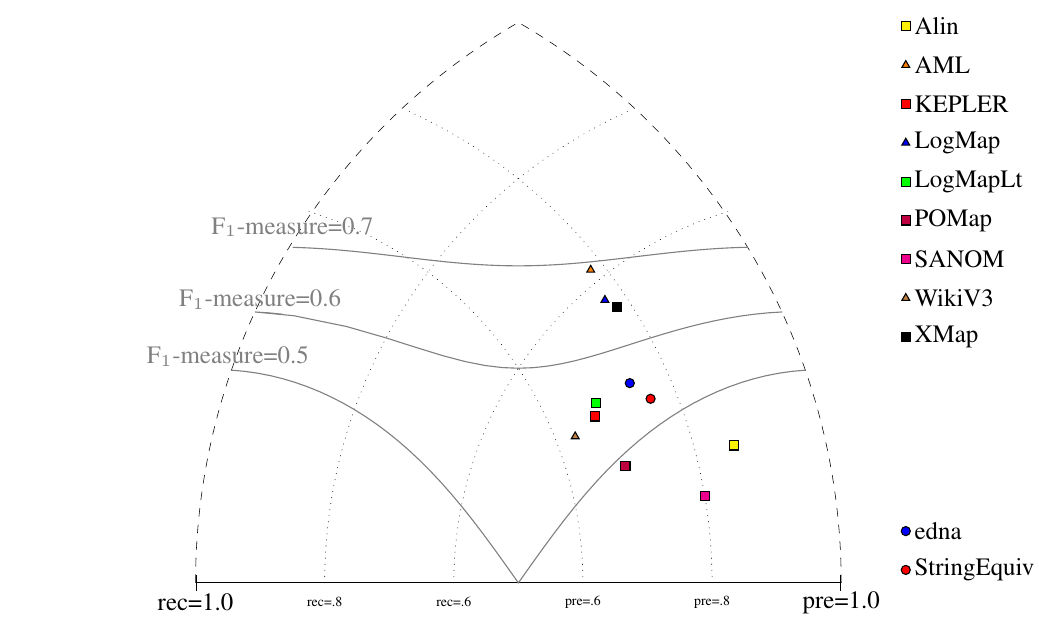
With regard to two baselines we can group tools according to matcher's position (above best edna baseline, above StringEquiv baseline, below StringEquiv baseline). There is not a difference among ra1-M3, ra2-M3 and rar2-M3 regarding tools position. LogMap has the largest drop (by 0.06 of F-Measure) between ra2-M3 and ra1-M3. In all there are four tools above edna baseline (AML, LogMap, XMap and LogMapLt) and further two tools performed better than StringEquiv (KEPLER and WikiV3) for rar2 reference alignment which is considered as most correct and most difficult reference alignment. Since rar2 is not only consistency violation free (as ra2) but also conservativity violation free we consider the rar2 as main reference alignment for this year. It will also be used within the synthesis paper.
Based on the evaluation variants M1 and M2 it can be seen that there are four tools (ALIN, POMap, ONTMAT and SANOM) which do not match properties at all. Of course, this has a negative effect on overall tools performance within the M3 evaluation variant.
The confidence values of all matches in the standard (sharp) reference alignments for the conference track are all 1.0. For the uncertain version of this track, the confidence value of a match has been set equal to the percentage of a group of people who agreed with the match in question (this uncertain version is based on reference alignment labeled ra1). One key thing to note is that the group was only asked to validate matches that were already present in the existing reference alignments - so some matches had their confidence value reduced from 1.0 to a number near 0, but no new matches were added
There are two ways that we can evaluate alignment systems according to these 'uncertain' reference alignments, which we refer to as discrete and continuous. The discrete evaluation considers any match in the reference alignment with a confidence value of 0.5 or greater to be fully correct and those with a confidence less than 0.5 to be fully incorrect. Similarly, an alignment system’s match is considered a 'yes' if the confidence value is greater than or equal to the system’s threshold and a 'no' otherwise. In essence, this is the same as the 'sharp' evaluation approach, except that some matches have been removed because less than half of the crowdsourcing group agreed with them. The continuous evaluation strategy penalizes an alignment system more if it misses a match on which most people agree than if it misses a more controversial match. For instance, if A = B with a confidence of 0.85 in the reference alignment and an alignment algorithm gives that match a confidence of 0.40, then that is counted as 0.85 * 0.40 = 0.34 of a true positive and 0.85 – 0.40 = 0.45 of a false negative.
Below is a graph showing the F-measure, precision, and recall of the different alignment systems when evaluated using the sharp (s), discrete uncertain (d) and continuous uncertain (c) metrics, along with a table containing the same information. The results from this year show that more systems are assigning nuanced confidence values to the matches they produce.
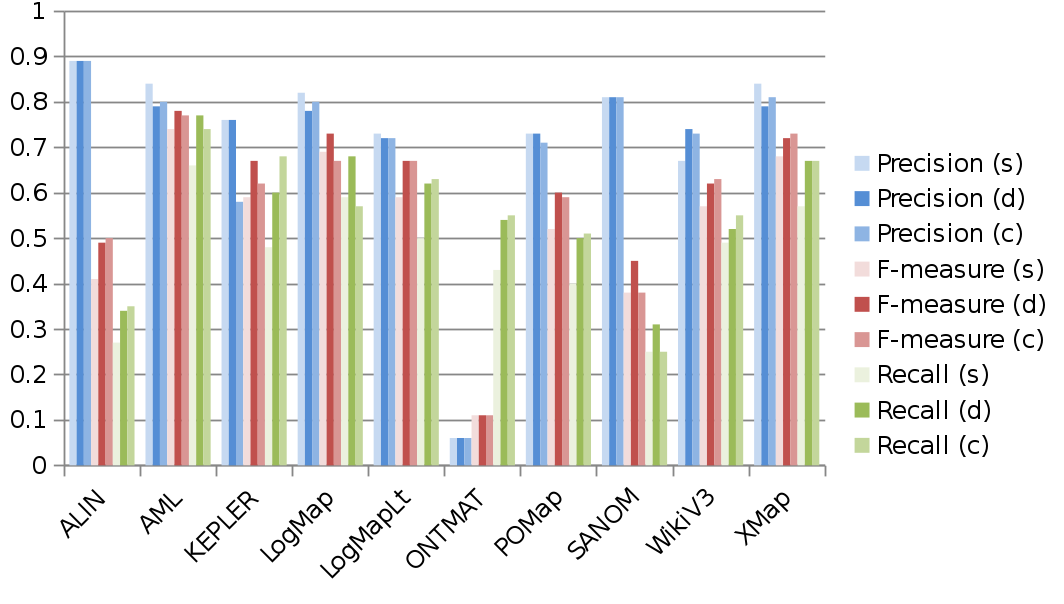
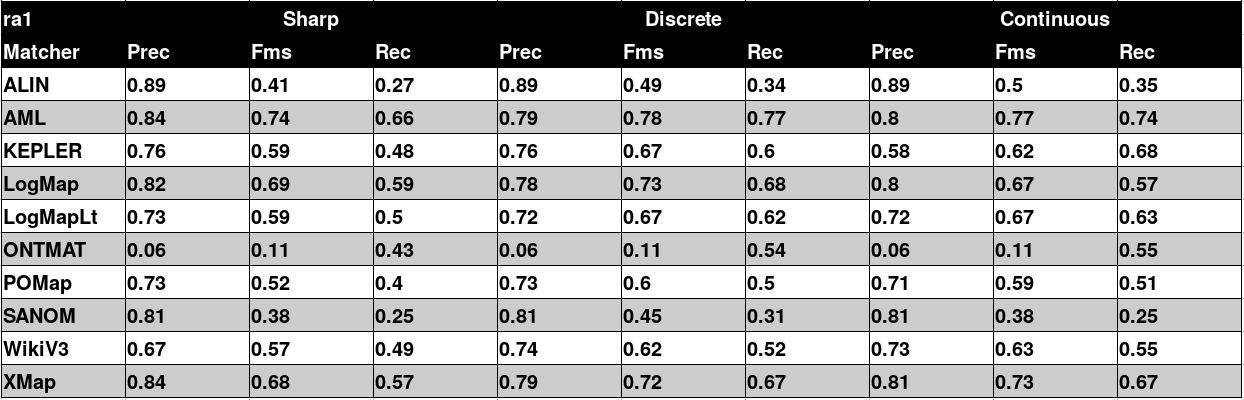
Out of the ten alignment systems, three (ALIN, LogMapLt and ONTMAT) use 1.0 as the confidence value for all matches they identify. Two more have a narrow range of confidence values (POMap’s values vary between 0.8 and 1.0, with the majority falling between 0.93 and 1.0 while SANOM’s values are relatively tightly clustered between 0.73 and 0.9). The remaining five systems (AML, KEPLER, LogMap, WikiV3 and XMap) have a wide variation of confidence values.
When comparing the performance of the matchers on the uncertain reference alignments versus that on the sharp version, we see that in the discrete case all matchers performed the same or better in terms of F-measure. Improvement in F-measure ranged from 0 to 8 percent over the sharp reference alignment. This was driven by increased recall, which is a result of the presence of fewer 'controversial' matches in the uncertain version of the reference alignment.
The performance of most matchers is very similar regardless of whether a discrete or continuous evaluation methodology is used (provided that the threshold is optimized to achieve the highest possible F-measure in the discrete case). The primary exceptions to this are KEPLER, LogMap and SANOM. These systems perform significantly worse when evaluated using the continuous version of the metrics. In the LogMap and SANOM cases, this is because the matcher assigns low confidence values to some matches in which the labels are equivalent strings, which many crowdsourcers agreed with unless there was a compelling technical reason not to. This hurts recall, but using a low threshold value in the discrete version of the evaluation metrics 'hides' this problem. In the case of KEPLER, the issue is that entities whose labels share a word in common have fairly high confidence values, even though they are often not equivalent. For example, Review and Reviewing_Event. This hurts precision in the continuous case, but is taken care of by using a high threshold value in the discrete case.
Five systems from this year also participated last year, and thus we are again able to make some comparisons over time. The F-measures of all systems essentially held constant (within one percent) when evaluated against the uncertain reference alignments. This is in contrast to last year, in which most systems made modest gains (in the neighborhood of 1 to 6 percent) over 2015. It seems that, barring any new advances, participating systems have reached something of a steady state on this performance metric.
For evaluation based on logical reasoning we applied detection of conservativity and consistency principles violations [2, 3]. While consistency principle proposes that correspondences should not lead to unsatisfiable classes in the merged ontology, conservativity principle proposes that correspondences should not introduce new semantic relationships between concepts from one of input ontologies [2].
Table below summarizes statistics per matcher. There are number of all alignments (#Align.), number of alignments (#Incoh.Align.) that cause unsatisfiable TBox after ontologies merge, total number of all conservativity principle violations within all alignments (#TotConser.Viol.) and its average per one alignment (#AvgConser.Viol.), total number of all consistency principle violations (#TotConsist.Viol.) and its average per one alignment (#AvgConsist.Viol.).
Five tools (ALIN, AML, LogMap, ONTMAT and POMap) have no consistency principle violation (in comparison to seven last year) and two tools (SANOM and XMap) generated only one incoherent alignment. There is one tool (ALIN) having no conservativity principle violations. Further two tools have average of conservativity principle around 1 (ONTMAT and POMap). We should note that these conservativity principle violations can be "false positives" since the entailment in the aligned ontology can be correct although it was not derivable in the single input ontologies.
| Matcher | #Align. | #Incoh.Align. | #TotConser.Viol. | #AvgConser.Viol. | #TotConsist.Viol. | #AvgConsist.Viol. |
|---|---|---|---|---|---|---|
| ALIN | 21 | 0 | 0 | 0 | 0 | 0 |
| AML | 21 | 0 | 39 | 1.86 | 0 | 0 |
| KEPLER | 21 | 12 | 123 | 5.86 | 159 | 7.57 |
| LogMap | 21 | 0 | 25 | 1.19 | 0 | 0 |
| LogMapLt | 21 | 5 | 96 | 4.57 | 25 | 1.19 |
| ONTMAT | 20 | 0 | 1 | 0.05 | 0 | 0 |
| POMap | 21 | 0 | 1 | 0.05 | 0 | 0 |
| SANOM | 21 | 1 | 11 | 0.52 | 18 | 0.86 |
| WikiV3 | 21 | 10 | 125 | 5.95 | 58 | 2.76 |
| XMap | 21 | 1 | 22 | 1.05 | 4 | 0.19 |
Here we list ten most frequent unsatisfiable classes appeared after ontologies merge by any tool. Five tools generated incoherent alignments.
ekaw#Rejected_Paper - 4
ekaw#Contributed_Talk - 4
ekaw#Camera_Ready_Paper - 4
ekaw#Accepted_Paper - 4
sigkdd#Conference - 3
sigkdd#ACM_SIGKDD - 3
iasted#Worker_non_speaker - 3
iasted#Student_registration_fee - 3
iasted#Student_non_speaker - 3
iasted#Nonauthor_registration_fee - 3
Here we list ten most frequent caused new semantic relationships between concepts within input ontologies by any tool:
iasted#Record_of_attendance, http://iasted#City - 8
	edas-iasted
conference#Invited_speaker, http://conference#Conference_participant - 7
	conference-sigkdd
	conference-ekaw
iasted#Video_presentation, http://iasted#Item - 4
	conference-iasted
	edas-iasted
iasted#Video_presentation, http://iasted#Document - 4
	conference-iasted
iasted#Sponzorship, http://iasted#Registration_fee - 4
	iasted-sigkdd
iasted#Sponzorship, http://iasted#Fee - 4
	iasted-sigkdd
iasted#Session_chair, http://iasted#Speaker - 4
	ekaw-iasted
	iasted-sigkdd
iasted#Presentation, http://iasted#Item - 4
	conference-iasted
	edas-iasted
iasted#Presentation, http://iasted#Document - 4
	conference-iasted
iasted#PowerPoint_presentation, http://iasted#Item - 4
	conference-iasted
	edas-iasted
We would like to thank to Alessandro Solimando for his help with running the code for logical reasoning based evaluation.
[1] Michelle Cheatham, Pascal Hitzler: Conference v2.0: An Uncertain Version of the OAEI Conference Benchmark. International Semantic Web Conference (2) 2014: 33-48.
[2] Alessandro Solimando, Ernesto Jiménez-Ruiz, Giovanna Guerrini: Detecting and Correcting Conservativity Principle Violations in Ontology-to-Ontology Mappings. International Semantic Web Conference (2) 2014: 1-16.
[3] Alessandro Solimando, Ernesto Jiménez-Ruiz, Giovanna Guerrini: A Multi-strategy Approach for Detecting and Correcting Conservativity Principle Violations in Ontology Alignments. OWL: Experiences and Directions Workshop 2014 (OWLED 2014). 13-24.
[4] Ondřej Zamazal, Vojtěch Svátek. The Ten-Year OntoFarm and its Fertilization within the Onto-Sphere. Web Semantics: Science, Services and Agents on the World Wide Web, 43, 46-53. 2017.