
| Note:The first results provided at the Ontology matching workshop and reproduced in its proceedings on CD-Rom were incorrect as far as line 2xx of Table 1 and Table 2 were concerned. |
The benchmark test case was exactly the same as last year. The only modification was, as announced, in the standardisation of the encoding on UTF-8 instead of ISO-8859-1.
The evaluation has been performed on the files provided by the participants (available here) which have been processed by the following script).
The first table provides the consolidated results, by groups of tests. We display the results of participants as well as those given by some very simple edit distance algorithm on labels (edna). Like last year, the computed values here are real precision and recall and not a simple average of precision and recall. The full results are on the OAEI web site.
These results show already that three systems are relatively close (coma, falcon and RiMOM). The RiMOM system is slightly ahead of the others on these raw results. The DSSim system obviously favoured precision over recall but its precision degrades with "real world" 3xx series. No system had strictly lower performance than edna (simple edit distance).
The results have also been compared with the three measures proposed in [Ehrig2005a] last year (symmetric, effort-based and oriented). These are generalisation of precision and recall in order to better discriminate systems that slightly miss the target from those which are grossly wrong. In the present case, the three measures provide the same results. This is not really surprising given the closeness of these measures. As expected, they can only improve over traditional precision and recall. The improvement affects all the algorithms, but this is not always strong enough for being reflected in the aggregated results (the variations can be observed in the full results for Symmetric, Oriented and Effort-based). Moreover, the new measures do not dramatically change the evaluation of the participating systems.
| algo | refalign | edna | automs | coma | DSSim | falcon | hmatch | jhuapl | OCM | prior | RiMOM | |||||||||||
|---|---|---|---|---|---|---|---|---|---|---|---|---|---|---|---|---|---|---|---|---|---|---|
| test | Prec. | Rec. | Prec. | Rec. | Prec. | Rec. | Prec. | Rec. | Prec. | Rec. | Prec. | Rec. | Prec. | Rec. | Prec. | Rec. | Prec. | Rec. | Prec. | Rec. | Prec. | Rec. |
| 1xx | 1.00 | 1.00 | 0.96 | 1.00 | 0.94 | 1.00 | 1.00 | 1.00 | 1.00 | 0.98 | 1.00 | 1.00 | 0.91 | 1.00 | 1.00 | 1.00 | 0.95 | 1.00 | 1.00 | 1.00 | 1.00 | 1.00 |
| 2xx | 1.00 | 1.00 | 0.90 | 0.49 | 0.94 | 0.64 | 0.96 | 0.82 | 0.99 | 0.49 | 0.91 | 0.85 | 0.83 | 0.51 | 0.20 | 0.86 | 0.93 | 0.51 | 0.95 | 0.58 | 0.97 | 0.87 |
| 3xx | 1.00 | 1.00 | 0.94 | 0.61 | 0.91 | 0.70 | 0.84 | 0.69 | 0.90 | 0.78 | 0.89 | 0.78 | 0.78 | 0.57 | 0.18 | 0.50 | 0.89 | 0.51 | 0.85 | 0.80 | 0.83 | 0.82 |
| H-mean | 1.00 | 1.00 | 0.91 | 0.54 | 0.94 | 0.67 | 0.96 | 0.83 | 0.98 | 0.55 | 0.92 | 0.86 | 0.84 | 0.55 | 0.22 | 0.85 | 0.93 | 0.55 | 0.95 | 0.63 | 0.96 | 0.88 |
| Symm | 1.00 | 1.00 | 0.91 | 0.54 | 0.94 | 0.68 | 0.96 | 0.83 | 0.99 | 0.55 | 0.94 | 0.89 | 0.85 | 0.56 | 0.22 | 0.87 | 0.93 | 0.55 | 0.96 | 0.64 | 0.97 | 0.89 |
| Ord | 1.00 | 1.00 | 0.91 | 0.54 | 0.94 | 0.68 | 0.96 | 0.83 | 0.99 | 0.55 | 0.94 | 0.89 | 0.85 | 0.56 | 0.22 | 0.87 | 0.93 | 0.55 | 0.96 | 0.64 | 0.97 | 0.89 |
| Effort | 1.00 | 1.00 | 0.91 | 0.54 | 0.94 | 0.68 | 0.96 | 0.83 | 0.99 | 0.55 | 0.94 | 0.89 | 0.85 | 0.56 | 0.22 | 0.87 | 0.93 | 0.55 | 0.96 | 0.64 | 0.97 | 0.89 |
All algorithms have their better score with the 1xx test series; there is no particular order between the two other series. Again, it is more interesting to look at the 2xx series structure to distinguish the strengths of algorithms.
This year the apparently best algorithms provided their results with confidence measures. It is thus possible to draw precision/recall curves in order to compare them.
We provide in Figure 1, the precision and recall graphs of this year. They involve only the results of participants who provided confidence measures different of 1 or 0. They also feature the results for edit distances on class names (edna) and the results of Falcon last year (falcon-2005). Note that the graph for falcon2005 is not really accurate (since falcon2005 provided 1/0 alignments last year). This graph has been drawn with only technical adaptation of the one used for TREC. Moreover, for reason of time these graphs have been computed by averaging the graphs of each tests (instead to pure precision and recall).
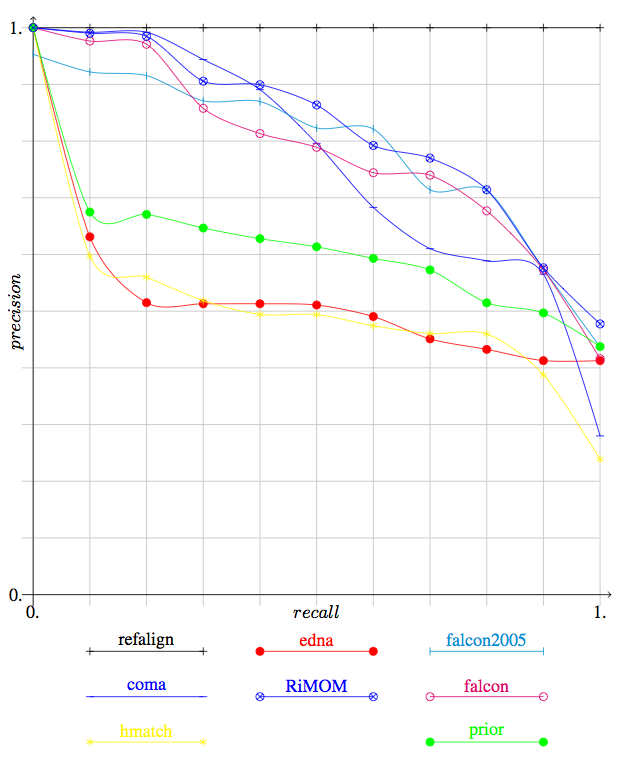
Figure 1: Precision/recall graphs between the system which provided confidence
values in their results.
Contrary to last year, we have three systems competing at the higest level (falcon, coma and RiMOM) and a gap between these and the next systems. No system is significantly outperformed by standard edit distance (edna).
On the basis of the 2004 tests, the three best systems (falcon, coma and RiMOM) arrive at the level of last year's best system (falcon). However, no system outperform it (see Table 2).
Unfortunately no representant of the group of systems that followed falcon last year is present this year. Like last year we have compared the results of this year's systems with the previous years on the basis of the 2004 tests.
| Year | 2004 | 2005 | 2006 | |||||||||
|---|---|---|---|---|---|---|---|---|---|---|---|---|
| System | fujitsu | stanford | falcon | RiMOM | falcon | coma | ||||||
| test | Prec. | Rec. | Prec. | Rec. | Prec. | Rec. | Prec. | Rec. | Prec. | Rec. | Prec. | Rec. |
| 1xx | 0.99 | 1.00 | 0.99 | 1.00 | 1.00 | 1.00 | 1.00 | 1.00 | 1.00 | 1.00 | 1.00 | 1.00 |
| 2xx | 0.93 | 0.84 | 0.98 | 0.72 | 0.98 | 0.97 | 1.00 | 0.98 | 0.97 | 0.97 | 0.99 | 0.97 |
| 3xx | 0.60 | 0.72 | 0.93 | 0.74 | 0.93 | 0.83 | 0.83 | 0.82 | 0.89 | 0.78 | 0.84 | 0.69 |
| H-means | 0.88 | 0.85 | 0.98 | 0.77 | 0.97 | 0.96 | 0.97 | 0.96 | 0.97 | 0.95 | 0.98 | 0.94 |
[Ehrig 2005] Marc Ehrig and Jérôme Euzenat. Relaxed precision and recall for ontology matching. In Ben Ashpole, Jérôme Euzenat, Marc Ehrig, and Heiner Stuckenschmidt, editors, Proc. K-Cap 2005 workshop on Integrating ontology, Banff (CA), pages 25-32, 2005.