
Tools have been evaluated based on reference alignment with regard to their precision, recall and F-measures performace. We also provide brief report about runtimes and about degree of alignment incoherence.
Regarding evaluation based on reference alignment, we first filtered out (from alignments generated using SEALS platform) all instance-to-any_entity and owl:Thing-to-any_entity correspondences prior to computing Precision/Recall/F1-measure/F2-measure/F0.5-measure because they are not contained in the reference alignment. In order to compute average Precision and Recall over all those alignments we used absolute scores (i.e. we computed precision and recall using absolute scores of TP, FP, and FN across all 21 test cases). This corresponds to micro average precision and recall. Therefore, resulted numbers can slightly differ with those computed by the SEALS platform (macro average precision and recall). Then, we computed F1-measure in a standard way. Finally, we found the highest average F1-measure with thresholding (if possible).
This year we have 10 participants. For overview table please see general information about results. We will also provide comparison with tools participated in previous years of OAEI in terms of highest average F1-measure.
You can download subset of all alignments for which there is a reference alignment. In this case we provide alignments as generated by the SEALS platform (afterwards we applied some tiny modifications which we explained above). Alignments are stored as it follows: matcher-ontology1-ontology2.rdf.
Reference alignment contains 21 alignments (test cases), which corresponds to the complete alignment space between 7 ontologies from the OntoFarm data set. This is a subset of all ontologies within this track (16). Total number of test cases is hence 120. There are two variants of reference alignment:
In order to provide some context for understanding matchers performance we included two simple string-based matchers as baselines. StringEquiv (before it was called Baseline1) is a string matcher based on string equality applied on local names of entities which were lowercased before (this baseline was also used within anatomy track 2012) and edna (string editing distance matcher) was adopted from benchmark track (wrt. performance it is very similar as previously used baseline2).
In the table below, there are results of all 10 tools with regard to the reference alignment (ra2). There are precision, recall, F1-measure, F2-measure and F0.5-measure computed for the threshold that provides the highest average F1-measure computed for each matcher. F1-measure is the harmonic mean of precision and recall. F2-measure (for beta=2) weights recall higher than precision and F0.5-measure (for beta=0.5) weights precision higher than recall.
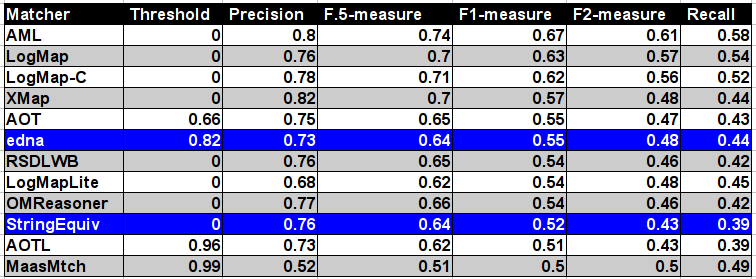
Tools are ordered according to their highest average F1-measure. According to matcher's position with regard to two baselines it can be in one of three basic groups:
For better comparison with previous years there is also table summarizing performance based on original reference alignment (ra1). In the case of evaluation based on ra1 the results are almost in all cases slightly better. The order of matchers according to F1-measure is preserved.
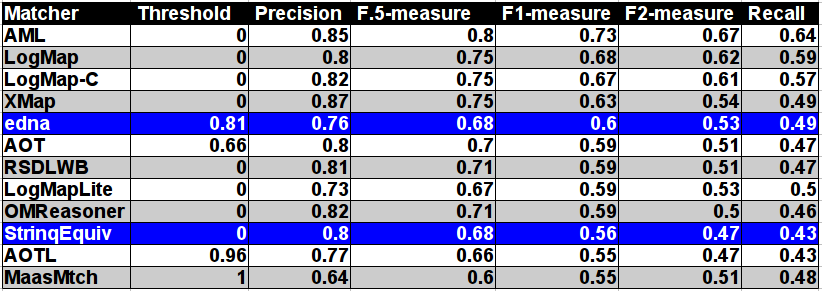
According to matcher's position with regard to two baselines it is completely the same as for the ra2 reference alignment.
All tools are visualized in terms of their performance regarding an average F1-measure in the figure below. Tools are represented as squares or triangles. Baselines are represented as circles. Horizontal line depicts level of precision/recall while values of average F1-measure are depicted by areas bordered by corresponding lines F1-measure=0.[5|6|7].
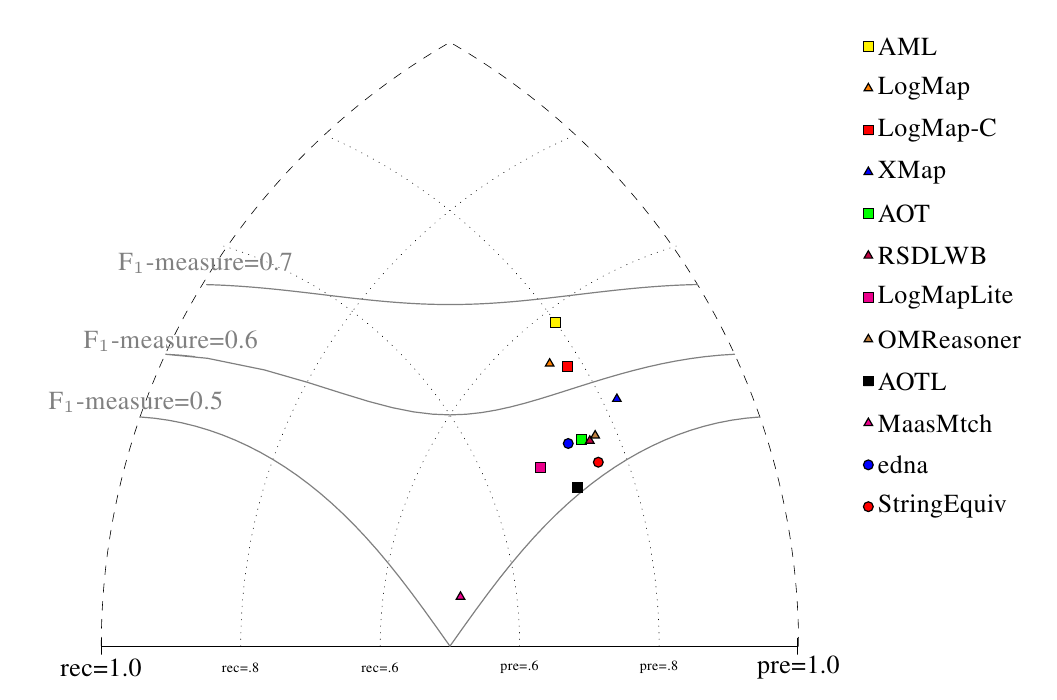
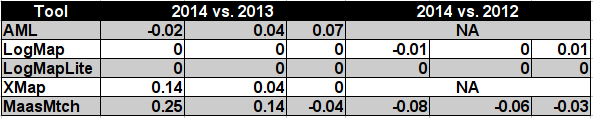
Table below summarizes performance results of tools participated last 3 years of OAEI, conference track with regard to reference alignment ra2.
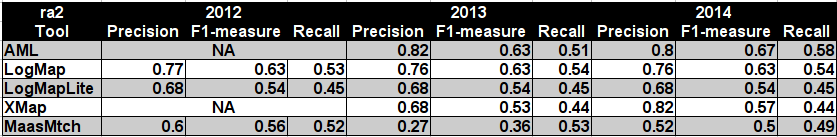
MaasMtch achieved the highest improvement between last two years (0.14 increase wrt. F1-measure), but its F1-measure decreased by 0.06 wrt. OAEI 2012. AML and XMap both achieved 0.04 increase wrt. F1-measure between OAEI 2014 and OAEI 2013, see Table below.
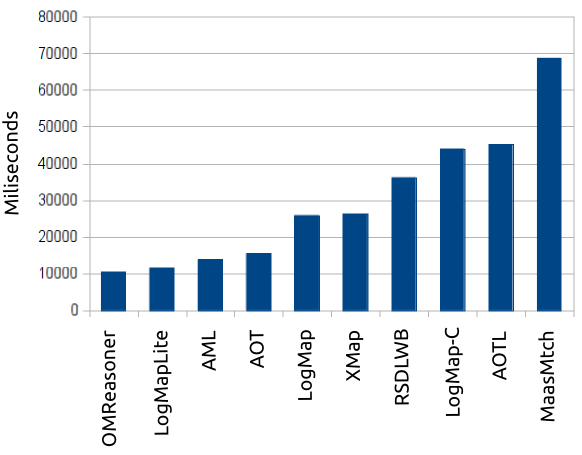
Next, we measured total runtime on generating those 21 alignments. It was executed on a laptop with Unbuntu machine running on Intel Core i5, 2.67GHz and 8GB RAM except run with MaasMtch which was run it on Intel Core i7, 2.10GHz x 4 and 16GB RAM.
Total runtimes of participated tools are in the plot below.
This year all tools finished all 21 testcases within 1 minute or around 1 minute.
As in the previous years, we apply the Maximum Cardinality measure to evaluate the degree of alignment incoherence. This metric measures the fraction of correspondences that have to be removed to select, with a minimum number of removals, a coherent subset of the input alignment. It differs from those metrics that are based on counting the number of unsatisfiable classes. Details on this measure and its implementation can be found in [1].
| Matcher | Average Alignmet Size | Number of incoherent alignments | Average Degree of Incoherence |
|---|---|---|---|
| AML | 10.952 | 0 | 0% |
| AOT* | 59.167 | 18 | 40.4% |
| AOTL | 14.667 | 17 | 15.1% |
| LogMap | 10.714 | 0 | 0% |
| LogMapC | 10.238 | 0 | 0% |
| LogMapLite | 9.905 | 7 | 5.4% |
| MaasMtch* | 33.000 | 19 | 21% |
| OMReasoner | 8.095 | 4 | 2.5% |
| RSDLWB | 8.333 | 4 | 2.5% |
| XMap | 8.143 | 0 | 0% |
We computed the average for all 21 test cases of the conference track for which there exists a reference alignment. In two cases (marked with an asterisk) we could not compute the exact degree of incoherence due to the combinatorial complexity of the problem, however we were still able to compute a lower bound for which we know that the actual degree is not lower.
The systems AML, LogMap (excluding LogMapLite, where reasoning option is disabled), and XMap generate coherent alignments. However, these systems generated coherent alignments already in the previous year. The other systems generate results with highly varying degree of incoherence. The degree of incoherence is correlated with the size of the generated alignments. This can be expected because smaller alignments are usually more precise and logical conflicts will occur only rarely. However, there are systems with relatively small alignments that cannot ensure coherence (e.g., OMReasoner and RSDLWB). Overall, the field has not improved compared to the previous year with respect to generating coherent alignments respecting the logical constraints implied by the axioms of the matched ontologies.
Contact address is Ondřej Zamazal (ondrej.zamazal at vse dot cz).
[1] Christian Meilicke. Alignment Incoherence in Ontology Matching. PhD thesis at University Mannheim 2011.