
The following content is (mainly) based on the final version of
the interactive section in the OAEI results paper.
If you notice any kind of error (wrong numbers, incorrect information on a matching system) do not hesitate to contact us.
The growth of the ontology alignment area in the past ten years has led to the development of many ontology alignment tools. After several years of experience in the OAEI, we observed that the results can only be slightly improved in terms of the alignment quality (precision/recall resp. F-measure). Based on this insight, it is clear that fully automatic ontology matching approaches slowly reach an upper bound of the alignment quality they can achieve. A work by (Jimenez-Ruiz et al., 2012) has shown that simulating user interactions with 30% error rate during the alignment process has led to the same results as non-interactive matching. Thus, in addition to the validation of the automatically generated alignments by domain experts, we believe that there is further room for improving the quality of the generated alignments by incorporating user interaction. User involvement during the matching process has been identified as one of the challenges in front of the ontology alignment community by (Shvaiko et al., 2013) and user interaction with a system is an integral part of it.
At the same time with the tendency of increasing ontology sizes, the alignment problem also grows. It is not feasible for a user to, for instance validate all candidate mappings generated by a system, i.e., tool developers should aim at reducing unnecessary user interventions. All required efforts of the human have to be taken into account and it has to be in an appropriate proportion to the result. Thus, beside the quality of the alignment, other measures like the number of interactions are interesting and meaningful to decide which matching system is best suitable for a certain matching task. By now, all OAEI tracks focus on fully automatic matching and semi-automatic matching is not evaluated although such systems already exist, e.g., overview in (Ivanova et al., 2015). As long as the evaluation of such systems is not driven forward, it is hardly possible to systematically compare the quality of interactive matching approaches.
In this third edition of the Interactive track we use three OAEI datasets, namely Conference, Anatomy and Large Biomedical Ontologies (Large Bio) dataset. The Conference dataset covers 16 ontologies describing the domain of conference organization. We only use the test cases for which an alignment is publicly available (altogether 21 alignments/tasks). The Anatomy dataset includes two ontologies (1 task), the Adult Mouse Anatomy (AMA) ontology and a part of the National Cancer Institute Thesaurus (NCI) describing the human anatomy. Finally, the Large Bio consists of 6 tasks with different sizes ranging from tens to hundreds of thousands classes and aims at finding alignments between the Foundational Model of Anatomy (FMA), SNOMED CT, and the National Cancer Institute Thesaurus (NCI).
The quality of the generated alignments in Conference, Anatomy and Large Bio tracks has been constantly increasing but in most cases only by a small amount (by a few percent). For example, in the Conference track in 2013, the best system according to F-measure (YAM++) achieved a value of 70% (Cuenca Grau et al., 2013). On the other hand, while the best result according to F-measure for the Anatomy track was achieved last year by AML with 94% there has been very little improvement over previous few campaigns (only few percent). This shows that there is room for improvement, which could be filled by interactive means.
The interactive matching track was organized at OAEI 2015 for the third time. The goal of this evaluation is to simulate interactive matching (Paulheim et al., 2013), where a human expert is involved to validate mappings found by the matching system. In the evaluation, we look at how interacting with the user improves the matching results. The SEALS client was modified to allow interactive matchers to ask an oracle. The interactive matcher can present a correspondence to the oracle, which then tells the system whether the correspondence is right or wrong. This year, in addition to emulating the perfect user, we also consider domain experts with variable error rates which reflects a more realistic scenario where a (simulated) user does not necessarily provide a correct answer. We experiment with three different error rates, 0.1, 0.2 and 0.3. The errors were randomly introduced into the reference alignment with given rates.
The evaluations of the Conference and Anatomy datasets were run on a server with 3.46 GHz (6 cores) and 8GB RAM allocated to the matching systems. Each system was run three times and the final result of a system for each error rate represents the average of these runs. This is the same configuration which was used in the non-interactive version of the Anatomy track and runtimes in the interactive version of this track are therefore comparable. For the Conference dataset with the ra1 alignment, we considered macro-average of precision and recall of different ontology pairs, while the number of interactions represent the total number of interactions in all tasks. Finally, the three runs are averaged. The Large Bio dataset evaluation (each system was run one time) was run on a Ubuntu Laptop with an Intel Core i7-4600U CPU @ 2.10GHz x 4 and allocating 15Gb of RAM.
Overall, four systems participated in the Interactive matching track: AML, JarvisOm, LogMap, and ServOMBI. The systems AML and LogMap have been further developed compared to the last year, the other two participated in this track for the first time. All systems participating in the Interactive track support both interactive and non-interactive matching. This allows us to analyze how much benefit the interaction brings for the individual system.
The different systems involve the user in different points of the execution and use the user input in different ways. Therefore, we describe how the interaction is done by each system. AML starts interacting with the user during the Selection and Repairing phases (for the Large Bio task only non-interactive repair is employed) at the end of the matching process. The user input is employed to filter the mappings included in the final alignment and AML does not generate new mappings or adjust matching parameters based on it. AML avoids asking the same question more than once by keeping track of already asked questions and uses a query limit and other strategies to stop asking the user and reverts to non-interactive mode. JarvisOM is based on an active learning strategy known as query-by-committee. In this strategy, informative instances are those where the committee members (classifiers; 3 in this campaign) disagree most. Sample entity pairs are selected using the heuristic of the Farthest First algorithm in order to initialize the classifiers committee. At every iteration JarvisOM asks the user for pairs of entities that have the highest value for the vote entropy measure (disagreement between committee members) and lower average euclidean distance. In the last iteration, the classifiers committee is used to generate the alignment between the ontologies. ServOMBI uses various similarity measures during the Terminological phase after which the results are presented to the user. The user input is then used in the Contextual phase which employs machine learning techniques. The user is then asked again to validate the newly generated candidate mappings (according to given threshold). At the end an algorithm is run to determine the mappings in the final alignment. LogMap generates candidate mappings first and then employs different techniques (lexical, structural and reasoning-based) to discard some of them during the Assessment phase. During this phase in the interactive mode it interacts with the user and presents to him/her these mappings which are not clear-cut cases.
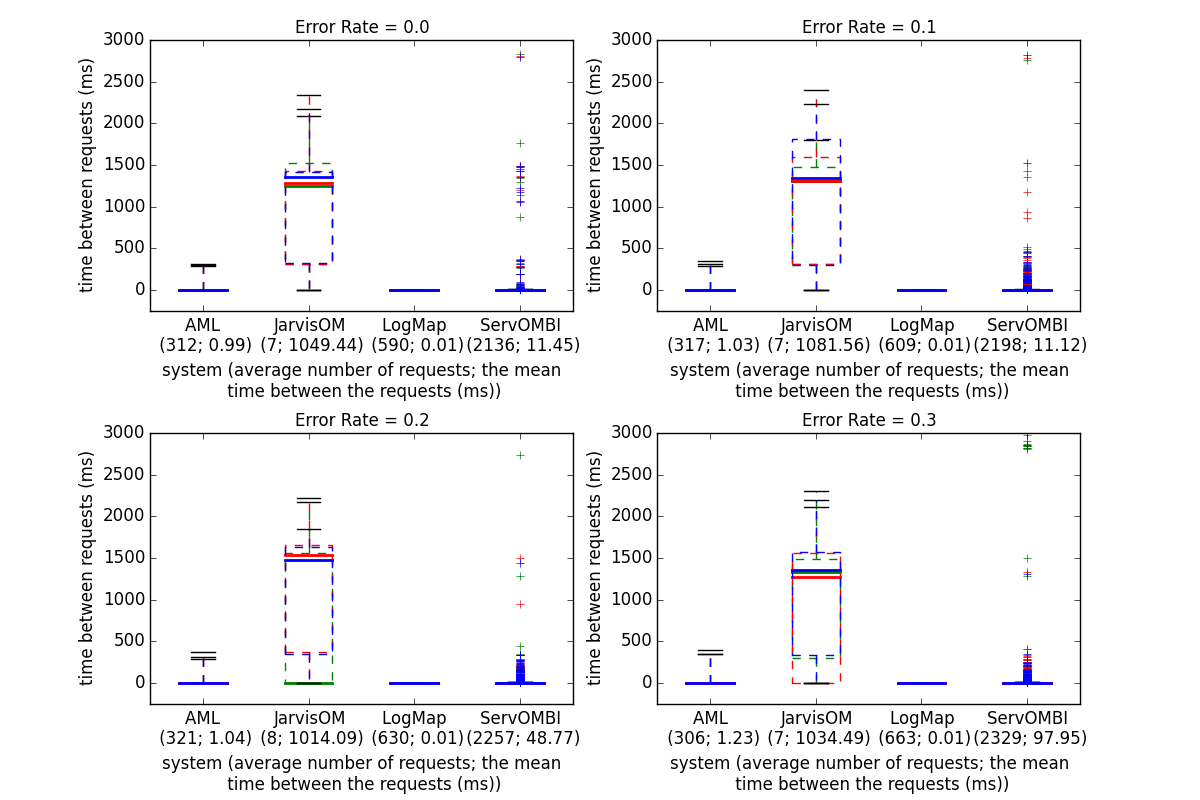
The four tables below present the results for the Anatomy dataset with four different error rates. The first six columns in each of the tables present the adjusted (the trivial correspondences in the oboInOwlnamespace have been removed as well as correspondences expressing relations different from equivalence) results obtained in this and the non-interactive Anatomy track. The measure recall+ indicates the amount of detected non-trivial correspondences (trivial correspondences are those with the same normalized label). The precision, recall and F-measure columns at the far right end of the table present the results as calculated by the SEALS client prior to the adjustment. The last three columns contain the evaluation results "according to the Oracle", meaning against the Oracle's alignment (i.e., the reference alignment as modified by the randomly introduced errors). Fig. 1 shows the time intervals between the questions to the user/oracle for the different systems and error rates for the three runs (the runs are depicted with different colors).
We first compare the performance of the four systems with an all-knowing oracle (0.0 error rate), in terms of precision, recall and F-measure, to the results obtained in the non-interactive Anatomy track (these are the first 6 columns in the corresponding tables). The effect of introducing interactions with the oracle/user is mostly pronounced for the precision measure (except JarvisOM see below). In the Interactive track (and 0.0 error rate) the precision for all four systems improves and, consequently, so does the F-measure. At the same time the recall improves for AML and JarvisOM and does not change for LogMap and ServOMBI. AML achieves the best F-measure and recall among the four with a perfect oracle. Out of all systems, JarvisOM displays the largest improvements when user interactions are brought in - the F-measure improves almost 4,5 times together with the recall which improves 6 times and the precision goes up 2,5 times. The size of the alignment generated by the system also grows around 2,5 times.
With the introduction of an erroneous oracle/user and moving towards higher error rates the systems performance, obviously, starts to slightly deteriorate in comparison to the all-knowing oracle. We can, however, observe that the changes in the error rates influence the four systems differently in comparison to the non-interactive results. While the AML performance with an all-knowing oracle is better on all measures with respect to the non-interactive results, the F-measure drops in the 0.2 and 0.3 cases, while the recall stays higher than the non-interactive results for all error rates. LogMap behaves similarly - the F-measure in the 0.2 and 0.3 cases drops below the non-interactive results, while the precision stays higher in all error rates. ServOMBI performance in terms of F-measure and Recall drops below the non-interactive results already in the 0.1 case, but the precision is higher in all cases. In contrast JarvisOM still performs better in the 0.3 case on all measures than in the non-interactive Anatomy track where it achieved very low values for all measures. It is also worth noting the large drop in precision (40%) for JarvisOM with the growing error rates in comparison to the other three systems where the drop in precision is between 1 to 5%. This could be explained by the fact that JarvisOM asks only few questions and is therefore very sensitive to false positives and false negatives. Another interesting observation is that, with the exception of AML, the performance of the systems also declines as the error increases with regard to the Oracle reference (i.e., the reference as modified by the errors introduced in the Oracle). This means that the impact of the errors is linear for AML (i.e., one erroneous response from the oracle, leads to only one error from AML) but supralinear for the other systems.
AML also shows stable performance in connection to the size of the alignment and the number of (distinct) requests to the oracle generated with different error rates. As discussed it does not present the same question again to the user. The same observation regarding the unique requests applies to JarvisOM and LogMap as well. It should be noted that JarvisOM uses very few requests to the oracle and this number is stable across the different error rates. Another notable difference is the varying size of the alignment generated by JarvisOM which almost doubles in the 0.2 case comparing to the all-knowing oracle. The number of requests grows with the error rate for LogMap together with a slight grow in the alignment size. As we noted above ServOMBI asks the user for every mapping found and the number of distinct requests for ServOMBI stays stable for the different rates. The total number of requests is almost double the distinct ones but at the same time the size of the alignment drops when introducing higher error rates. The run times between the different error rates slightly change for AML while there is no significant change for LogMap and JarvisOM. The ServOMBI run time decreases with the increase of the error rate. In comparison to the non-interactive track, LogMap's and JarvisOM's run times do not change and AML's run time changes between 10% to 20%. ServOMBI run time is higher in the non-interactive track.
For an interactive system the time intervals at which the user is involved in an interaction are important. Fig. 1 presents a comparison between the systems regarding the time periods at which the system presents a question to the user. Across the three runs and different error rates the AML and LogMap requests intervals are around 1 and 0 milliseconds respectively. On the other hand, while the requests periods for ServOMBI are under 10 ms in most of the cases we see that there are some outliers requiring more than a second. Furthermore a manual inspection of the intervals showed that in several cases it takes more than 10 seconds between the questions to the user and in one extreme case --- 250 seconds. It can also be seen that the requests intervals for this system increase at the last 50-100 questions. JarvisOM displays a delay in its requests in comparison to the other systems. The average interval at which a question is presented to the user is 1 second with about half of the requests to the user taking more than 1,5 seconds. However it issues the quetions during the alignemnt process and not as a post processing step.
The take away of this analyses is the large improvement for JarvisOM in all measures and error rates with respect to its non-interactive results. The growth of the error rate impacts different measures in the different systems. The effect of introducing interactions with the oracle/user is mostly pronounced for the precision measure - the precision for all systems (except AML) in the different error rates is higher than their precision in the evaluation of the non-interactive Anatomy track.
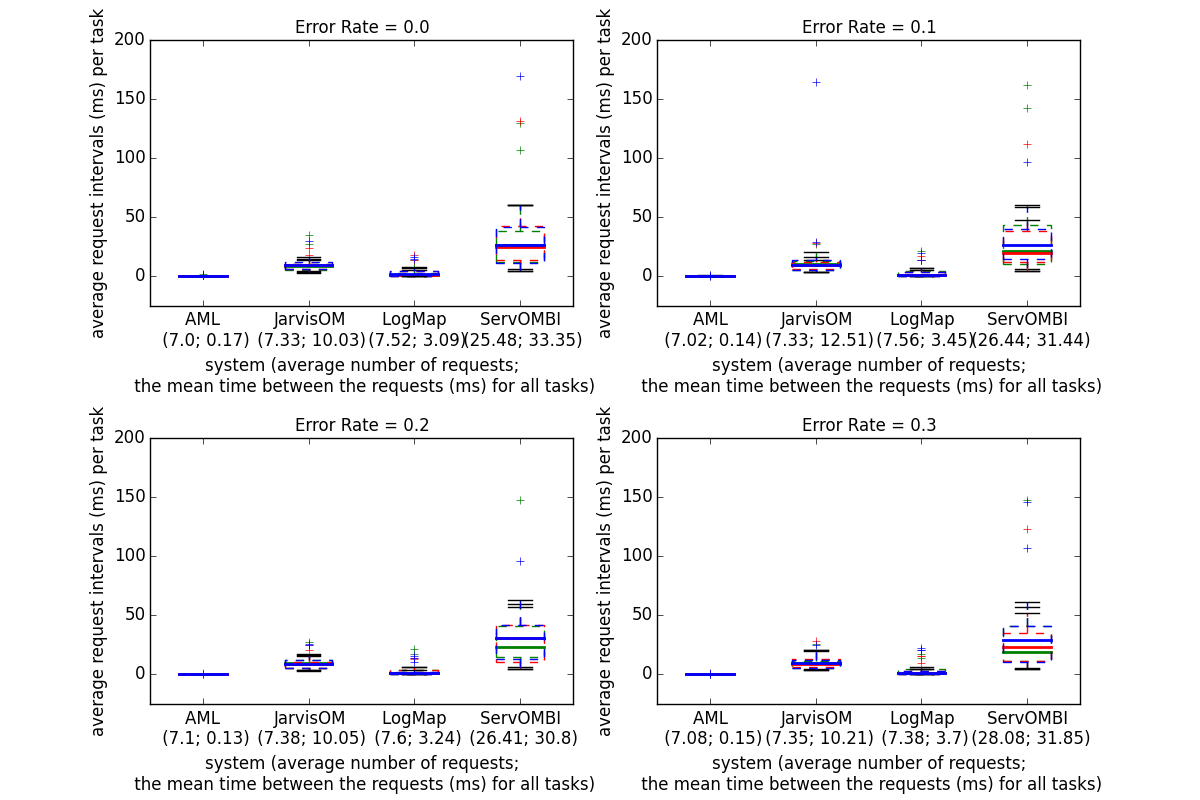
The four tables below present the results for the Conference dataset with four different error rates. The "Precision Oracle", "Recall Oracle" and "F-measure Oracle" columns contain the evaluation results "according to the Oracle", meaning against the Oracle's alignment (i.e., the reference alignment as modified by the randomly introduced errors). Fig. 2 shows the average requests intervals per task (21 tasks in total per run) between the questions to the user/oracle for the different systems and error rates for all tasks and the three runs (the runs are depicted with different colors). The first number under the system names is the average number of requests and the second number is the average period of the average requests intervals for all tasks and runs.
We first focus on the performance of the systems with an all-knowing oracle. In this case, all systems improve their results compared to the non-interactive version of the Conference track. The biggest improvement in F-measure is achieved by ServOMBI with 20%. Other systems also show substantial improvements, AML improves the F-measure by around 8%, JarvisOM by around 13% and LogMap by around 4%. Closer inspection shows that for different systems the improvement of F-measure can be attributed to different factors. For example, in the case of ServOMBI and LogMap interaction with the user improved precision while recall experienced only slight improvement. On the other hand, JarvisOM improved recall substantially while keeping similar level of precision. Finally, AML improved both precision and recall by more than 6 percent which contributed to a higher F-measure.
As expected, the results start deteriorating when introducing the error in the oracle's answers. Interestingly, even with the error rate of 0.3 most systems perform similar (with respect to the F-measure) to their non-interactive version. For example, AML's F-measure in the case with 0.3 error rate is only 0.5% worse than the non-interactive one. The most substantial difference is in the case of ServOMBI with an oracle with the error rate of 0.3 where the system achieves around 5% worse result than in the non-interactive version. Again closer inspection shows that different systems are affected in different ways when errors are introduced. For example, if we compare the 0.0 and 0.3 case, we can see that for AML, precision is affected by 10% and recall by 6%. In the case of JarvisOM, precision drops by 20% while recall drops by only 3%. LogMap is affected in the similar manner and its precision drops by 10% while the recall drops by only 2%. Finally, the most substantial change is in the case of ServOMBI where the precision drops from 100% to around 66% and recall shows a drop of 22%. Like in the Anatomy dataset, LogMap and ServOMBI also show a drop in performance in relation to the Oracle reference with the increase of the error rate, which indicates a supralinear impact of the errors. AML again shows a constant performance that reflects a linear impact of the errors. Surprisingly, JarvisOM also shows a constant performance, which is a different behaviour than what it showed in the Anatomy case.
When it comes to number of request to the oracle, we can see that 3 out of 4 systems do around 150 requests while ServOMBI does most requests, namely 550. AML, JarvisOM and LogMap do not repeat their requests while around 40% of requests done by ServOMBI are repeated requests. Across the three runs and different error rates the AML and LogMap mean times between requests for all tasks are less than 3 ms. On the other hand, mean time between requests for ServOMBI and JarvisOM are around 30 and 10 ms respectively. While in most cases there is little to no delay between requests, there are some outliers. These are most prominent for ServOMBI where some requests were delayed for around 2 seconds which is substaintally longer than the mean.
This year we have two systems which competed in the last year's campaign, i.e., AML and LogMap. When comparing to the results of last year (perfect oracle), AML improved its F-measure by around 2%. This increase can be accounted to increased precision (increase of around 3%). On the other hand, LogMap shows a slight decrease in recall and precision, and hence, in F-measure.
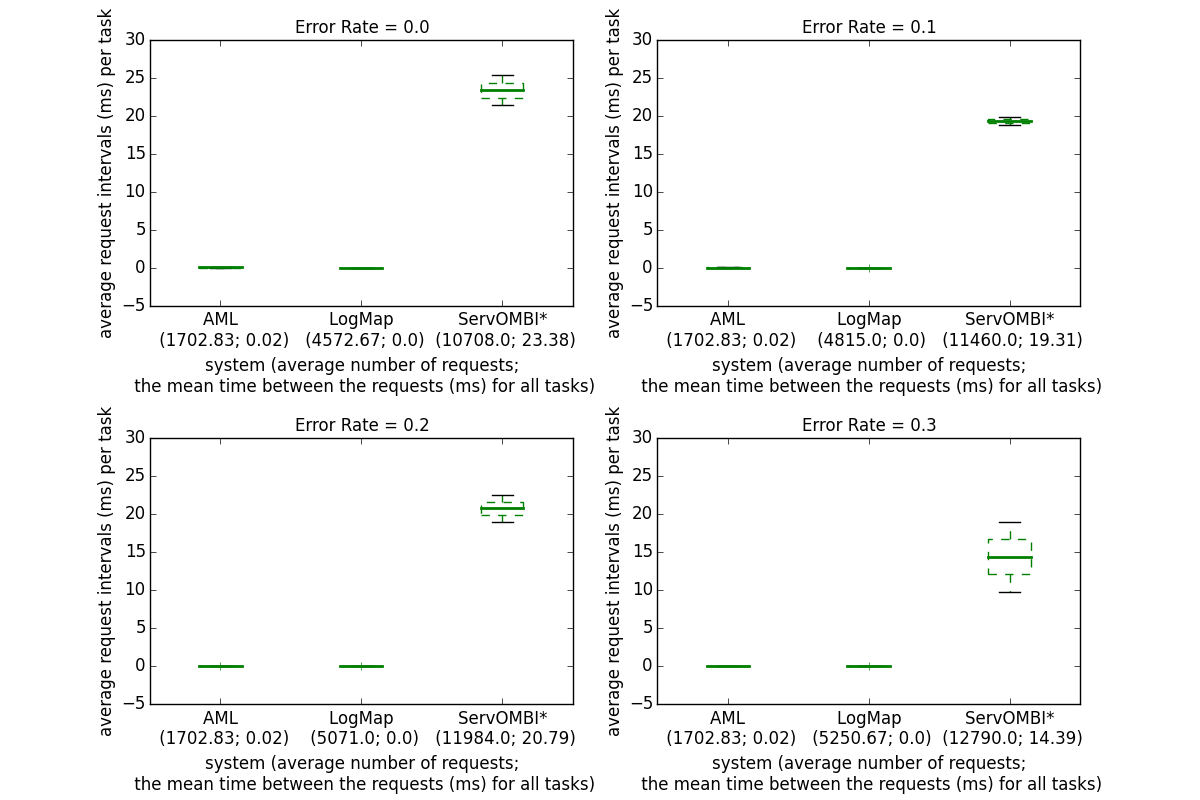
The four tables below present the results for the Large Bio dataset with four different error rates. The "Precision Oracle", "Recall Oracle" and "F-measure Oracle" columns contain the evaluation results "according to the Oracle", meaning against the Oracle's alignment (i.e., the reference alignment as modified by the randomly introduced errors). Fig. 3 shows the average requests intervals per task (6 tasks in total) between the questions to the user/oracle for the different systems and error rates for all tasks and a single runs. The first number under the system names is the average number of requests and the second number is the average period of the average requests intervals for all tasks in the run.
Of the four systems participating in this track this year, only AML and LogMap were able to complete the full Large Bio dataset. ServOMBI was only able to match the FMA-NCI small fragments and FMA-SNOMED small fragments, whereas JarvisOM was unable to complete any of the tasks. Therefore, ServOMBI's results are partial, and not directly comparable with those of the other systems (marked with * in the results table and Fig. 3).
With an all-knowing Oracle, AML, LogMap and ServOMBI all improved their performance in comparison with the non-interactive version of the Large Bio track. The biggest improvement in F-measure was achieved by LogMap with 3.2%, followed by AML with 2.6%, then ServOMBI with 1.4%. AML showed the greatest improvement in terms of recall, but also increased its precision substantially; LogMap had the greatest improvement in terms of precision, but also showed a significant increase in recall; and ServOMBI improved essentially only with regard to precision, obtaining 100% as in the other datasets.
The introduction of (simulated) user errors had a very different effect on the three systems: AML shows a slight drop in performance of 3% F-measure between 0 and 30% error, and is only slightly worse than its non-interactive version at 30% error; LogMap shows a more pronounced drop of 5.7% F-measure; and ServOMBI shows a substantial drop of 16.6% F-measure. Unlike in the other datasets, all systems are affected significantly by the error with regard to both precision and recall. Like in the other datasets, AML shows a constant performance in relation to the Oracle reference, indicating a linear impact of the errors, whereas the other two systems decrease in performance as the error increases, indicating a supralinear impact of the errors.
Regarding the number of request to the oracle, AML was the more sparing system, with only 10,217, whereas LogMap made almost three times as many requests (27,436). ServOMBI was again the more inquisitive system, with 21,416 requests on only the two smallest tasks in the dataset (for comparison, AML made only 1,823 requests on these two tasks and LogMap made 6,602). As in the other datasets, ServOMBI was the only system to make redundant requests to the Oracle. Interestingly, both LogMap and ServOMBI increased the number of requests with the error, whereas AML had a constant number of requests. Fig. 3 presents a comparison between the systems regarding the average time periods for all tasks at which the system presents a question to the user. Across the different error rates the average requests intervals for all tasks for AML and LogMap are around 0 millisecond. For ServOMBI they are slightly higher (25 milliseconds on average) but a manual inspection of the results shows some intervals larger than 1 second (often those are between some of the last requests the system performs).
This year is the first time we have considered a non-perfect domain expert, i.e., a domain expert which can provide wrong answers. As expected, the performance of the systems deteriorated with the increase of the error rate. However, an interesting observation is that the errors had different impact on different systems reflecting the different interactive strategies employed by the systems. In some cases erroneous answers from the oracle had the highest impact on the recall, in other cases on the precision, and in others still both measures were significantly affected. Also interesting is the fact that the impact of the errors was linear in some systems and supralinear in others, as reflected by their performance in relation to the Oracle alignment. A supralinear impact of the errors indicates that the system is making inferences from the user and thus deciding on the classification of multiple mapping candidates based on user feedback about only one mapping. This is an effective strategy for reducing the burden on the user, but alas leaves the matching system more susceptible to user errors. An extreme example of this is JarvisOM on the Anatomy dataset, as it uses an active-learning approach based on solely 7 user requests, and consequently is profoundly affected when faced with user errors given the size of the Anatomy dataset alignment. Curiously, this system behaves very differently in the Conference dataset, showing a linear impact of the errors, as in this case 7 requests (which is the average number it makes per task) represent a much more substantial portion of the Conference alignments (~50%) and thus leads to less inferences and consequently less impact of errors.
Apart from JarvisOM, the other systems all make use of user interactions exclusively in post-matching steps to filter their candidate mappings. LogMap and AML both request feedback on only selected mapping candidates (based on their similarity patterns or their involvement in unsatisfiabilities). By contrast, ServOMBI employs the user to validate all its mapping candidates (after two distinct matching stages), which corresponds to user validation rather than interactive matching. Consequently, it makes a much greater number of user requests than the other systems, and in being the system most dependent on the user, is also the one most affected by user errors.
With regard still to the number of user requests, it is interesting to note that both ServOMBI and LogMap generally increased the number of requests with the error, whereas AML and JarvisOM kept their number approximately constant. The increase is natural, as user errors can lead to more complex decision trees when interaction is used in filtering steps and inferences are drawn from the user feedback (such as during alignment repair) which leads to an increased number of subsequent requests. JarvisOM is not affected by this because it uses interaction during matching and makes a fixed 7-8 requests per matching task, whereas AML prevents it by employing a maximum query limit and stringent stopping criteria.
Two models for system response times are frequently used in the literature (Dabrowski et al., 2011): Shneiderman and Seow take different approaches to categorize the response times. Shneiderman takes task-centred view and sort out the response times in four categories according to task complexity: typing, mouse movement (50-150 ms), simple frequent tasks (1 s), common tasks (2-4 s) and complex tasks (8-12 s). He suggests that the user is more tolerable to delays with the growing complexity of the task at hand. Unfortunately no clear definition is given for how to define the task complexity. The Seow's model looks at the problem from a user-centred perspective by considering the user expectations towards the execution of a task: instantaneous (100-200 ms), immediate (0.5-1 s), continuous (2-5 s), captive (7-10 s); Ontology alignment is a cognitively demanding task and can fall into the third or forth categories in both models. In this regard the response times (request intervals as we call them above) observed with the Anatomy dataset (with the exception of several measurements for ServOMBI) fall into the tolerable and acceptable response times in both models. The same applies for the average requests intervals for the 6 tasks in the Large Bio dataset. The average request intervals for the Conference dataset are lower (with the exception of ServOMBI) than those discussed for the Anatomy dataset. It could be the case however that the user could not take advantage of very low response times because the task complexity may result in higher user response time (analogically it measures the time the user needs to respond to the system after the system is ready).
Bernardo Cuenca Grau , Zlatan Dragisic , Kai Eckert & et al. "Results of the Ontology Alignment Evaluation Initiative 2013" OM 2013. [pdf]
Heiko Paulheim, Sven Hertling, Dominique Ritze. "Towards Evaluating Interactive Ontology Matching Tools". ESWC 2013. [pdf]
Ernesto Jimenez-Ruiz, Bernardo Cuenca Grau, Yujiao Zhou, Ian Horrocks. "Large-scale Interactive Ontology Matching: Algorithms and Implementation". ECAI 2012. [pdf]
Valentina Ivanova, Patrick Lambrix, Johan Åberg. "Requirements for and evaluation of user support for large-scale ontology alignment". ESWC 2015. [publisher page]
Pavel Shvaiko, Jérôme Euzenat. "Ontology matching: state of the art and future challenges". Knowledge and Data Engineering 2013. [publisher page]
Jim Dabrowski, Ethan V. Munson. "40 years of searching for the best computer system response time". Interacting with Computers 2011. [publisher page]
This track is currently organized by Zlatan Dragisic, Daniel Faria, Valentina Ivanova, Ernesto Jimenez Ruiz, Patrick Lambrix, and Catia Pesquita.
If you have any problems working with the ontologies or any suggestions related to this track, feel free to write an email to ernesto [at] cs [.] ox [.] ac [.] uk or ernesto [.] jimenez [.] ruiz [at] gmail [.] com
We thank Dominique Ritze and Heiko Paulheim, the organisers of the 2013 and 2014 editions of this track, who were very helpful in the setting up of the 2015 edition.
The track is partially supported by the Optique project.