
In the following, we present the results of the OAEI 2013 evaluation of the benchmarks track.
All tests have been run entirely from the SEALS platform with the strict same protocol.
This year we run a minimalistic campaign with only one test set which is a regeneration of the bibliography test set. We did not run this year scalability tests.
We run a version of the benchmark test suite generated from the usual bibliography ontology. They had been by the test generator described in [1]. The test case was not available to participants (blind). The tests were also blind for the organisers since we did not looked into them before running the systems.
The following table summarizes the information about ontology sizes.
| Test set | classe+props | instances | entities | triples |
| biblio | 97 | 112 | 209 | 1332 |
The data set used is available here. They are also available under the SEALS platform at:
| Repository: | http://seals-test.sti2.at/tdrs-web/ |
| Suite-ID: | 2013benchmarks-biblioc |
| Version-ID: | 2013benchmarks-biblioc-r1,-r2,-r3,-r4,-r5 |
We run the experiments on a Debian Linux virtual machine configured with four processors and 8GB of RAM running under a Dell PowerEdge T610 with 2*Intel Xeon Quad Core 2.26GHz E5607 processors and 32GB of RAM, under Linux ProxMox 2 (Debian).
All matchers where run under the SEALS client using Java 1.7 and a maximum heap size of 6GB. No timeout was explicitly set.
Reported figures are the average of 5 runs. As has already been shown in [1], there is not much variance in compliance measures across runs. This is not necessarily the case for time measurements so we report standard deviations with time measurements.
From the 23 systems listed in the 2013 final results page, 21 systems participated in this track. Three systems were only participating in the instance matching track, XMap has two different system versions. A few of these systems encountered problems (marked * in the results table):
The following table presents the harmonic means of precision, F-measure and recall for the test suites for all the participants, along with their confidence-weighted values. The table also shows measures provided by edna, a simple edit distance algorithm on labels which is used as a baseline.
| biblio2 | biblioc | time | |||||||
| Raw results | 2012 | 1 - 2 - 3 - 4 - 5 | raw | ||||||
| (1 - 2 - 3 - 4 - 5) | |||||||||
| Matching system | Prec. | F-m. | Rec. | Prec. | F-m. | Rec. | Sec. | St. Dev. | pt F-m./s |
| edna | 0.46(0.61) | 0.48(0.55) | 0.50 | 0.35(0.58) | 0.41(0.54) | 0.50 | |||
| AML | 1.00 | 0.57 | 0.40 | 55 | ±6 | 1.04 | |||
| CIDER-CL | 0.85(0.84) | 0.75(0.66) | 0.67(0.55) | 844 | ±19 | 0.09 | |||
| CroMatcher | 0.95(0.75) | 0.88(0.68) | 0.82(0.63) | 1114 | ±21 | 0.08 | |||
| Hertuda | 0.93 | 0.67 | 0.53 | 0.90 | 0.68 | 0.54 | 72 | ±6 | 0.94 |
| Hotmatch | 0.99 | 0.68 | 0.52 | 0.96 | 0.68 | 0.50 | 103 | ±6 | 0.66 |
| IAMA | 0.99 | 0.73 | 0.57 | 102 | ±10 | 0.72 | |||
| LogMap | 1 | 0.64(0.59) | 0.47(0.42) | 0.72 | 0.53(0.51) | 0.42(0.39) | 123 | ±7 | 0.43 |
| LogMapLt | 0.95 | 0.66 | 0.50 | 0.43 | 0.46 | 0.50 | 57 | ±7 | 0.81 |
| MaasMtch (*) | 0.6(0.93) | 0.6(0.65) | 0.6(0.5) | 0.84(0.66) | 0.69(0.50) | 0.59(0.41) | 173 | ±6 | 0.40 |
| MapSSS (*) | 1.00 | 0.86 | 0.75 | 0.84 | 0.14 | 0.08 | 81 | ±44 | 0.17 |
| ODGOMS | 0.99(0.98) | 0.71(0.70) | 0.55(0.54) | 100 | ±6 | 0.71 | |||
| OntoK | 0.63(0.69) | 0.51 | 0.43(0.40) | 10241 | ±347 | 0.00 | |||
| RiMOM2013 | 0.59(0.49) | 0.58(0.19) | 0.58(0.12) | 105 | ±34 | 0.55 | |||
| ServOMap (*) | 1.00 | 0.67 | 0.5 | 0.53 | 0.33 | 0.22 | 409 | ±33 | 0.08 |
| StringsAuto (*) | 0.84 | 0.14 | 0.08 | 56 | ±38 | 0.25 | |||
| Synthesis | 0.60 | 0.60 | 0.60 | 659 | ±11 | 0.09 | |||
| WeSeE | 1 | 0.69(0.68) | 0.52 | 0.96 | 0.55 | 0.39 | 4933 | ±40 | 0.01 |
| Wikimatch | 0.97 | 0.67(0.68) | 0.52 | 0.99 | 0.69 | 0.53 | 1845 | ±39 | 0.04 |
| XMapGen | 0.66 | 0.54(0.52) | 0.46(0.44) | 594 | ±5 | 0.09 | |||
| XMapSig | 0.70(0.71) | 0.58(0.59) | 0.50 | 612 | ±11 | 0.09 | |||
| YAM++ | 0.96(1.00) | 0.89(0.72) | 0.82(0.56) | 0.97(0.84) | 0.89(0.77) | 0.82(0.70) | 702 | ±46 | 0.13 |
Concerning F-measure results, YAM++ (.89) and CroMatcher (.88) are far ahead before Cider-CL (.75), IAMA (.73) and ODGOMS (.71). Without surprise, such systems have all the same profile: their precision is higher that their recall.
With respect with 2012, some systems maintained their performances or slightly improved them (YAM++, MaasMatch, Hetuda, HotMatch, WikiMatch) while other showed severe degradations. Some of these are explained by failures (MapSSS, ServOMap, LogMap) some others are not explained (LogMapLite, WeSee). It is noteworthy, and strange, that most of the systems which did not complete all the tests were systems which completed them in 2012!
Confidence-weighted measures reward systems able to provide accurate confidence values. Using confidence-weighted F-measures does not increase the evaluation of systems (beside EDNA which does not perform any filtering). In principle, the weighted recall cannot be higher, but the weighted precision can. In fact, only edna, OntoK and XMapSig see their precision increase. The order given above does not change much with the weighted measures: IAMA and ODGOMS pass CroMatcher and Cider-CL. The only system to suffer a dramatic decrease is RiMOM, owing to the very low confidence measures that RiMOM provides.
Matchers with lower performance than the baseline are those mentioned before as encountering problems when running tests. This is a problem that such matchers are not robust to these classical tests.
There is a large discrepancy between matchers concerning the time spent from less than a minute for LogMapLite and AML (we do not count StringsAuto which failed to perform many tests) to nearly three hours for OntoK. In fact, OntoK takes as much time as all the other matchers together. Beside these large differences, we also observed large deviations across runs.
We provide the average F-measure point provided per second by matchers. This makes a different ordering of matchers: AML (1.04) comes first before Hertuda (0.94) and LogMapLite (0.81). None of the matchers with the best performances come first. This means that for achieving good results, considerable time should be spent (however, YAM++ still performs in less than 12 minutes for 94 matching operation).
For the systems which have provided their results with confidence measures different from 1 or 0, it is possible to draw precision/recall graphs in order to compare them; these graphs are given in the next figure. The graphs show the real precision at n% recall and they stop when no more correspondences are available; then the end point corresponds to the precision and recall reported in the first table shown above.
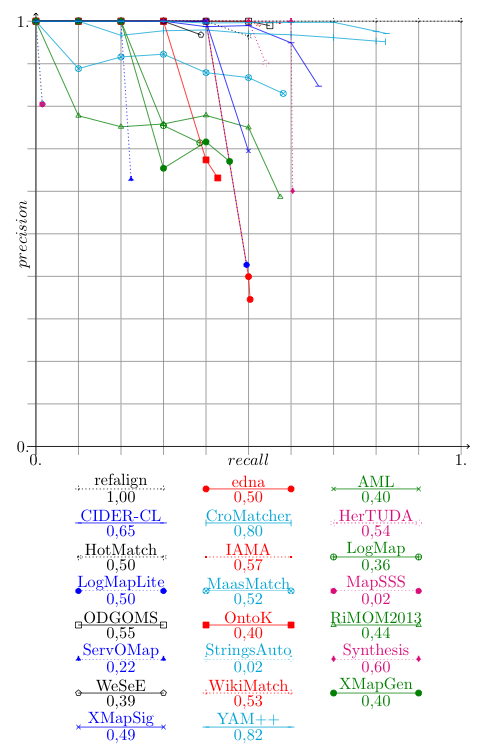
The precision-recall curves confirm the good performances of YAM++ and CroMatcher. CroMatcher achieves the same level of recall as YAM++ but with consistently lower precision. The curves show the large variability across systems participating. This year, systems seems to be less focussed on precision and make progress at the expense of precision. However, this may be an artifact due to systems having problems.
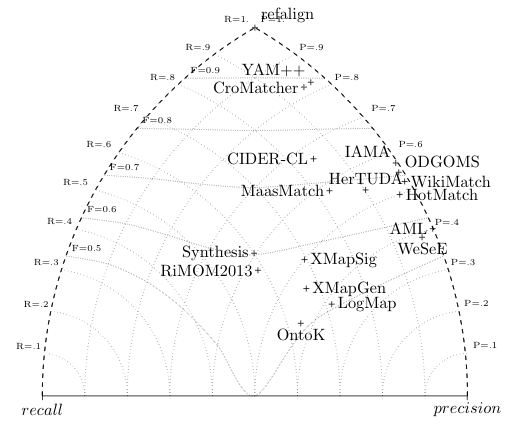
The triangle graph identifies several groups of systems:
This track has been performed by Jérôme Euzenat. If you have any problems working with the ontologies, any questions or suggestions, feel free to contact him
[1] Jérôme Euzenat, Maria Roşoiu, Cássia Trojahn dos Santos. Ontology matching benchmarks: generation, stability, and discriminability, Journal of web semantics 21:30-48, 2013 [DOI:10.1016/j.websem.2013.05.002]